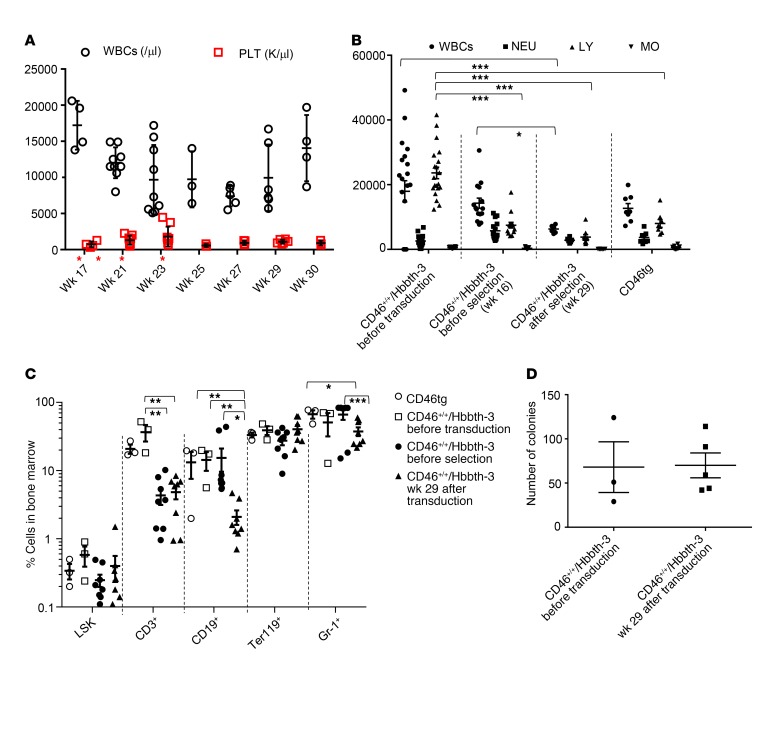
Figure 9. Safety of in vivo transduction/selection in the CD46+/+/Hbbth-3 mouse model.
(A) WBC and platelet (PLT) counts during and after in vivo selection. O6BG/BCNU treatment is indicated by red asterisks. n ≥ 3. (B) Absolute numbers of circulating WBC subpopulations. n ≥ 3. (C) Cellular bone marrow composition in control and treated mice sacrificed at week 29. Shown is the percentage of lineage marker–positive cells (Ter119+, CD3+, CD19+, and Gr-1+ cells) and HSPCs (LSK cells). (D) Colony-forming potential of bone marrow cells harvested at week 29. Each symbol represents an individual animal. *P ≤ 0.05, **P ≤ 0.0002, ***P ≤ 0.00003. Statistical analyses were performed using 2-way ANOVA. NEU: neutrophils; LY: lymphocytes; MO: monocytes.

