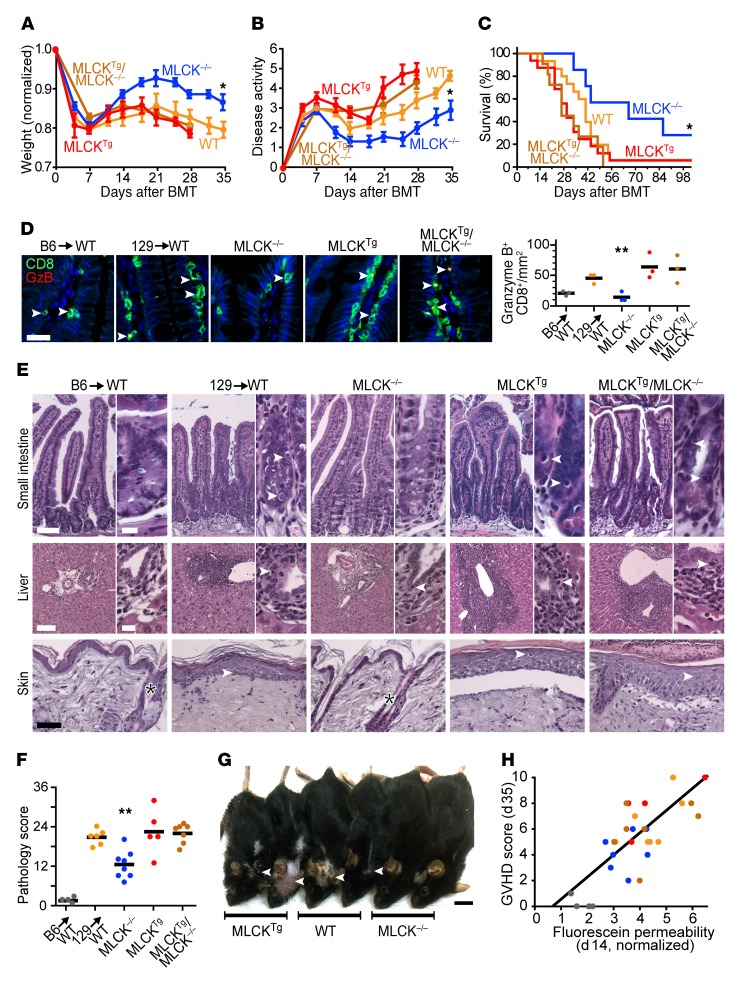
Figure 5. GVHD severity is modulated by intestinal epithelial MLCK210.
B6 recipients of the indicated genotypes were lethally irradiated, followed by a 129 BMT. (A) Relative weight and (B) disease activity scores (n = 6–9/group). *P < 0.05, ANOVA with Bonferroni’s correction vs. all other conditions. (C) Survival (n = 8–15/group). *P < 0.05, Kaplan-Meier log-rank test, MLCK–/– compared with all other groups. (D) Sections of jejunum were immunostained for CD8 (green) and granzyme B (red) 35 days after BMT. Representative images are shown. Arrowheads indicate colocalization. Scale bar: 20 μm. Each point represents an individual mouse. **P < 0.01, ANOVA with Bonferroni’s correction for MLCK210-KO mice vs. all other conditions (except syngeneic BMT) on d35. (E) Histopathology of jejunum (arrowheads denote apoptotic epithelial cells), liver (arrowheads denote lymphocytes infiltrating biliary epithelium), and skin (arrowheads denote apoptotic squamous cells, asterisks indicate preserved pilosebaceous units) on d35. Scale bars: intestine, 100 μm, 20 μm; liver, 300 μm, 50 μm; skin, 300 μm. (F) Total pathology scores (sum of jejunum, liver, and skin scores) 35 days after BMT. Each point represents an individual mouse. **P < 0.01, ANOVA with Bonferroni’s correction (vs. all other conditions). (G) Gross photos of 2 mice/group 35 days after BMT. Arrowheads point to hair loss and skin ulcers. Scale bar: 1 cm. (H) Correlation between intestinal permeability to fluorescein at 2 weeks after BMT and GVHD severity 5 weeks after BMT. Each point represents an individual mouse. Colors correspond to those for each condition shown in F. r = 0.75, P < 0.01 by Pearson’s correlation coefficient and degrees of freedom.

