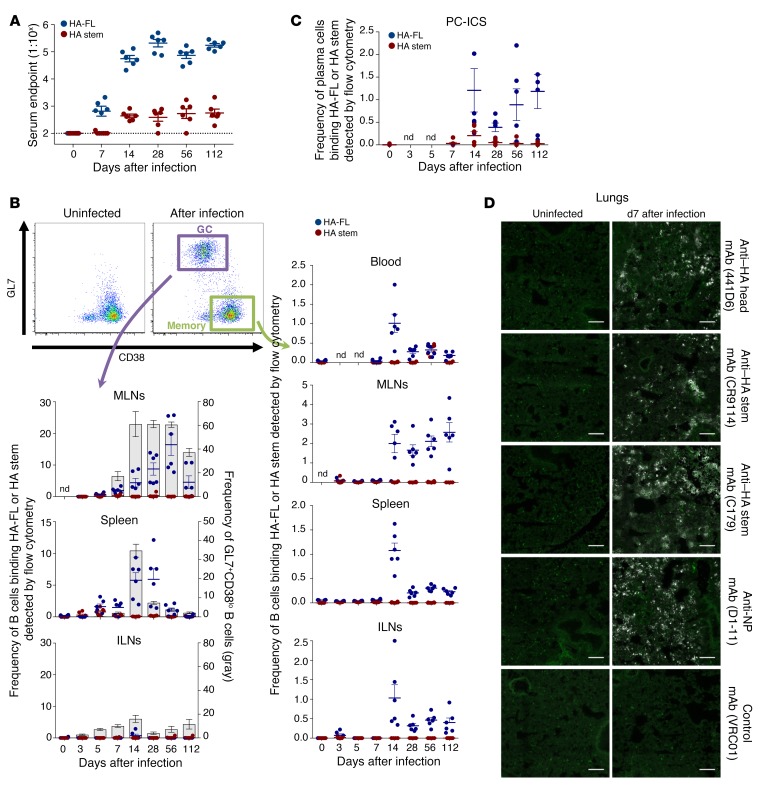
Figure 1. Serological and B cell responses in experimentally infected mice.
(A) Serum endpoint total IgG titers were measured by ELISA using HA-FL (blue) or stabilized HA stem (red) in mice infected intranasally with PR8 (n = 6 per time point). Dotted lines denote the detection cutoff (1:100 dilution). Data represent the mean ± SEM. (B) Frequency of GC B cells (B220+IgD–CD38loGL7+) and memory B cells (B220+IgD–CD38hiGL7–) binding HA-FL (blue) or HA stem (red) (n = 6). Data represent the mean ± SEM. (C) Frequency of plasma cells (CD138+B220–IgD–) binding HA-FL (blue) or HA stem (red) (n = 6). Data represent the mean ± SEM. (D) HA bioavailability visualized by monoclonal anti–HA head or anti–HA stem antibody staining (white) and B220+ B cell staining (green). Scale bars: 100 μm.

