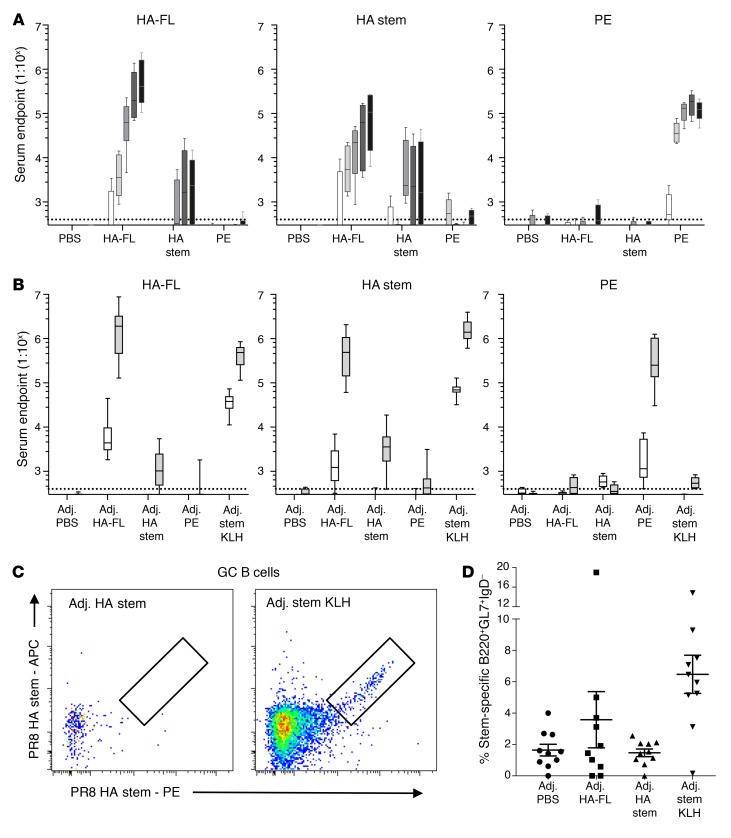
Figure 3. Serological and B cell responses in primary vaccinated mice.
Serum endpoint total IgG titers were measured by ELISA using HA-FL, HA stem, or PE proteins in mice that were immunized (A) 5 times with unadjuvanted immunogens or (B) 2 times with adjuvanted (Addavax) immunogens (n = 10 from 2 independent experiments with groups of 5 animals). Mice were immunized at 3-week intervals, and serum was collected every 2 weeks after immunization. Dotted lines denote the detection cutoff (dilution 1:400). Box boundaries represent 25th and 75th percentiles, the inner line represents the median, and whiskers represent minimum and maximum values. (C) Representative flow cytometric plots and (D) frequency of GC B cells (B220+IgD–CD38loGL7+) from mice vaccinated once with adjuvanted (Addavax) immunogens double stained with HA stem probes (PR8) (n = 10 from 2 independent experiments with groups of 5 animals). Data indicate the mean ± SEM. Adj., adjuvant.

