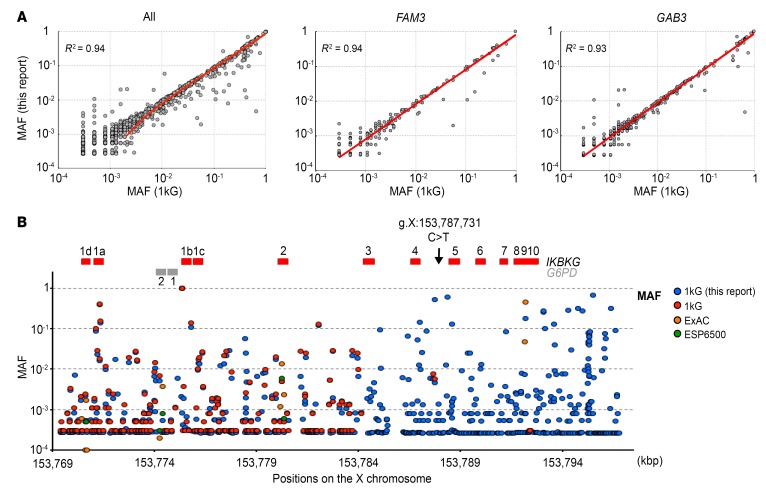
Figure 3. Reanalysis of the IKBKG locus with 1kG Project data.
(A) Correlation between the MAF of each variant in this study and the MAF reported in the 1kG Project. Plots show all the variants except for the IKBKG locus and the correlation for variants of FAM3 and GAB3, respectively. (B) Magnification of the IKBKG locus, for a comparison of the variants identified in this study (blue circles) with those reported in the various databases (red, orange, and green circles correspond to 1kG, ExAC, and ESP6500 databases, respectively). IKBKG exons are depicted by red bars and G6PD by gray bars.

