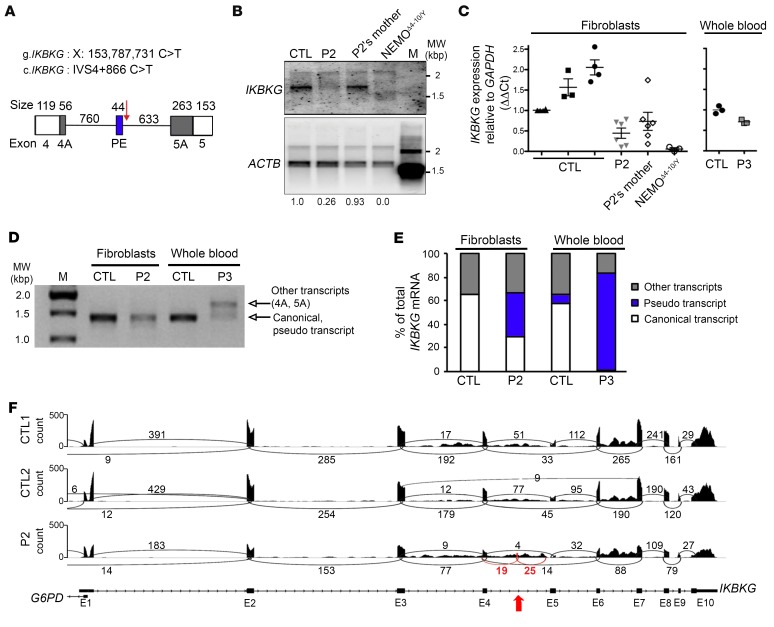
Figure 4. The IVS4+866 C>T intronic mutation causes aberrant IKBKG splicing.
(A) Description of the impact of the mutation on the IKBKG transcript, focusing on the junction of exons 4 and 5. The PE (blue rectangle) was found in P2 and P3 but not in the controls. White rectangles indicate exons 4 and 5, and black rectangles indicate the alternative donor site (exon 4A) or the alternative acceptor site (exon 5A) found in the patients and controls. The IVS4+866 C>T mutation is indicated by a red arrow. (B) Northern blot analysis of purified mRNA from a control, P2 and his mother, and NEMOΔ4–10/Y SV40-immortalized fibroblasts. The mRNAs were hybridized with a full-length 32P-labeled IKBKG or ACTB cDNA. (C) RT-qPCR analysis of total cDNA from controls, P2 and his mother, and NEMOΔ4–10/Y SV40-immortalized fibroblasts, and of whole-blood cells from a control and P3. Data are expressed as ΔΔCt normalized against GAPDH. The mean ± SD of the data obtained from 8 independent experiments is shown for the fibroblasts. The mean of triplicate experiments is shown for whole-blood cells and is representative of 2 independent experiments. (D) Full-length IKBKG amplification of purified mRNA from control and P2 SV40-immortalized fibroblasts as well as from whole-blood cells from a control and P3. (E) Schematic representation of IKBKG transcripts obtained after TA cloning experiments on controls, P2, and P3 from D. Approximately 100 clones were sequenced, and the results are expressed as percentages. (F) Sashimi plot of the RNA-Seq data from SV40-immortalized control (CTL1 and CTL2) and P2 fibroblasts. The red arrow indicates the position of IVS4+866 C>T and the new exon. Black and red numbers indicates the number of reads overlapping 2 consecutive exons. E1, E2, etc., exon 1, exon 2, etc.; M, molecular weight ladder; MW, molecular weight.

