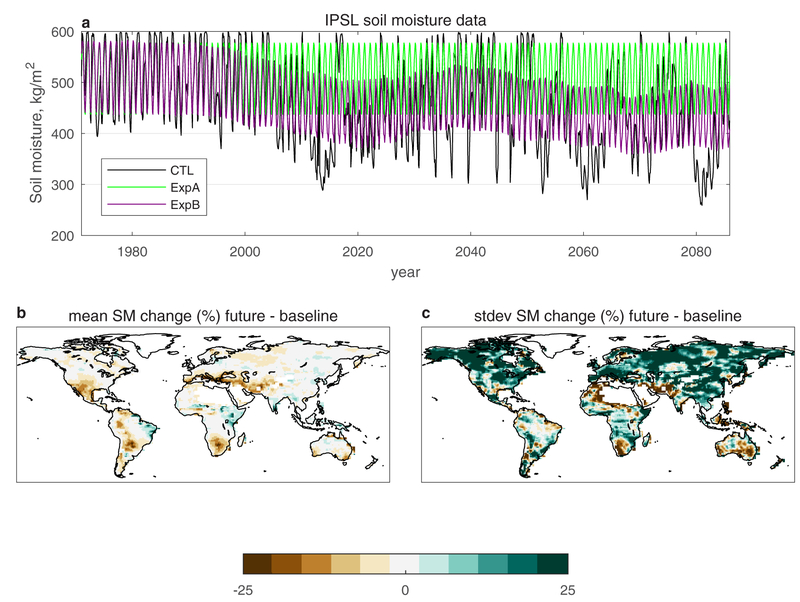
Extended Data Fig. 6. GLACE-CMIP5 soil moisture.
Monthly soil moisture data from the GLACE-CMIP5 experiment from a pixel in Central Mexico for the IPSL model over the 21st century (a). The CTL is the RCP8.5 soil moisture, while experiment A imposes the mean climatology of soil moisture from 1971–2000, and experiment B imposes soil moisture as the 30-year running mean through the 21st century. The percent change in mean soil moisture between the future and baseline periods in the CTL averaged across the 4 GLACE-CMIP5 models (b), and the percent change in soil moisture variability between the future and baseline periods in the CTL averaged across the 4 GLACE-CMIP5 models (c).

