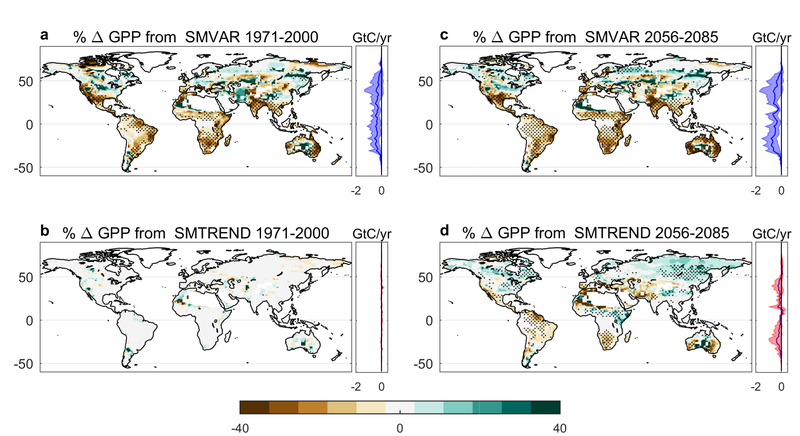
Extended Data Fig. 1. GPP regional changes.
Percentage changes in GPP due to soil moisture variability and soil moisture trend during a baseline (1971–2000) (a, b) and a future period (2056–2085) (c, d). Stippling highlights regions where the three models agree on the sign of the change. Latitudinal GPP plots accompany these subplots to show how the percentage changes translates to an overall GPP magnitude across latitudes. The thick line in each represents the model mean while the shaded areas show the model spread.

