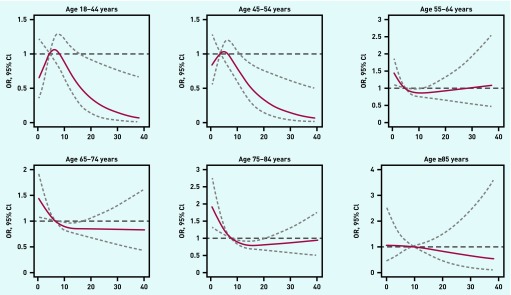
Figure 3.
Association between the GP’s suspicion of cancer (y-axis) and the patient’s usual consultation frequency (defined according to the patient’s number of face-to-face contacts in the 19–36 months before the cancer diagnosis) (x-axis) for six age groups as estimated using cubic spline models with three knots (reference = median number of usual consultations). The solid lines in figures depict estimated odds ratio, dashed lines depict 95% confidence limits.

