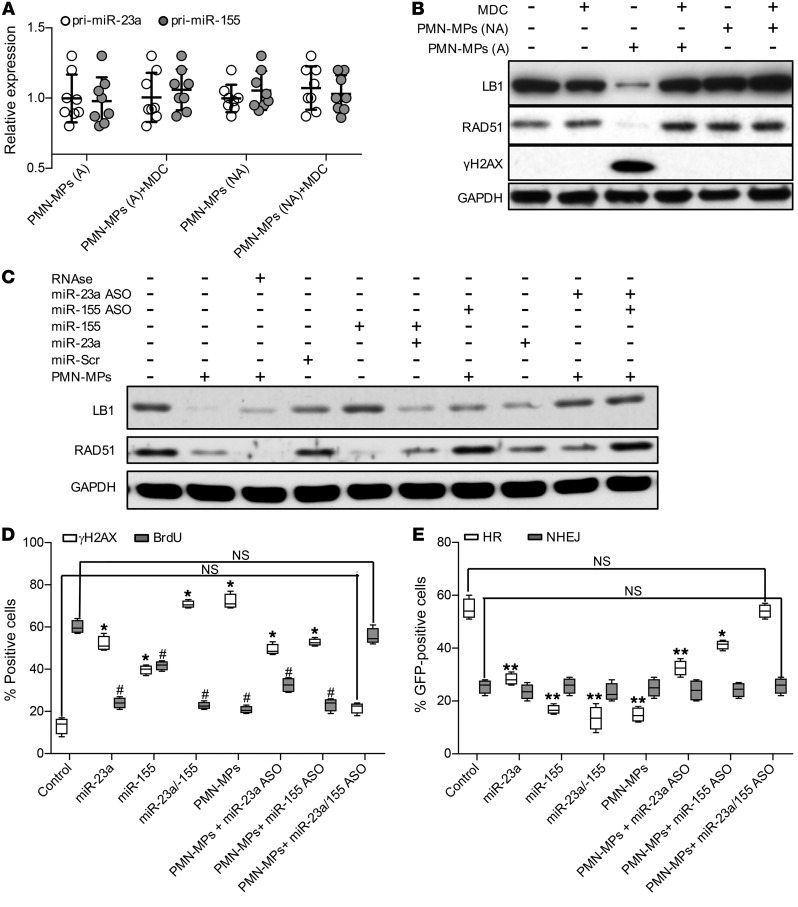
Figure 4. PMN-MP–derived miR-23a and miR-155 induce downregulation of RAD51 and LB1.
(A) Expression analysis of pri-miR-23a and miR-155 in IECs treated with MPs derived from either fMLF-activated PMNs (1 μM, activated [A], nonactivated control [NA], or nonactivated PMNs; n = 8). (B) Immunoblotting analysis of IECs treated with active versus nonactive PMN-MPs (24 hours) and with or without IEC pretreatment with the endocytosis inhibitor MDC (50 μM, 45 minutes; n = 3). (C) Immunoblotting of IECs treated with PMN-MPs (24 hours) with or without pretreatment with RNase (10 μg/ml, 45 minutes) and with or without the addition of miR-23a and miR-155 mimics or ASOs (1 nM each; n = 3). (D) PMN-MP–treated IECs (24 hours) were immunostained for γH2AX (a DSB marker) and BrdU incorporation (a replication marker) as described in Methods. At least 700 cells per marker per treatment were analyzed (n = 4; γH2AX, *P < 0.01, different from control; BrdU, #P < 0.01, different from control). (E) Analysis of EGFP reconstitution by HR or NHEJ following the indicated treatment (n = 4, *P < 0.05; **P < 0.01). One-way ANOVA was used for statistical analyses (P values). Data are mean ± SD from at least 3 independent experiments.

