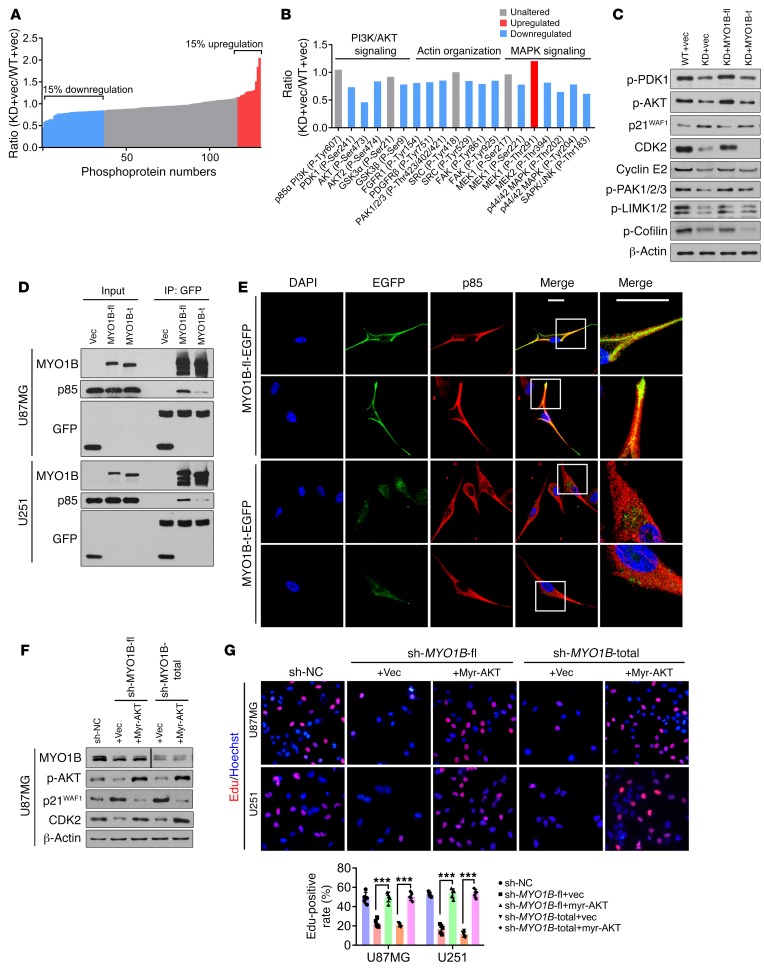
Figure 10. SRSF1-guided MYO1B splicing determines cell fate through the PDK1/AKT and PAK/LIMK pathways.
(A and B) Phosphoproteome array analysis of the expression changes of phosphoproteins upon SRSF1 knockdown in U87MG cells. The levels of the individual proteins were normalized to total protein levels. Phosphoproteins whose levels increased or decreased by more than 15% were labeled red and blue, respectively. (C) Western blot of the indicated proteins in the extracts of U87MG cells. (D) Co-IP confirmation of the interaction between EGFP-fused MYO1B proteins (MYO1B-fl and MYO1B-t) and endogenous p85 PI3K in U87MG and U251 cells. (E) Subcellular distribution of exogenous MYO1B-fl or MYO1B-t (green) and endogenous p85 PI3K (red) in U87MG cells. Scale bar: 20 μm. Representative images from triplicate biological experiments are shown. (F) Western blot of the indicated proteins in U87MG cells. The lanes for MYO1B were on the same gel but noncontiguous. (G) Representative images of EdU staining from triplicate biological experiments (left) and quantification (right). Original magnification, ×400. Data are presented as mean ± SD, n = 5. ***P < 0.001 by 1-way ANOVA with Tukey’s post test.

