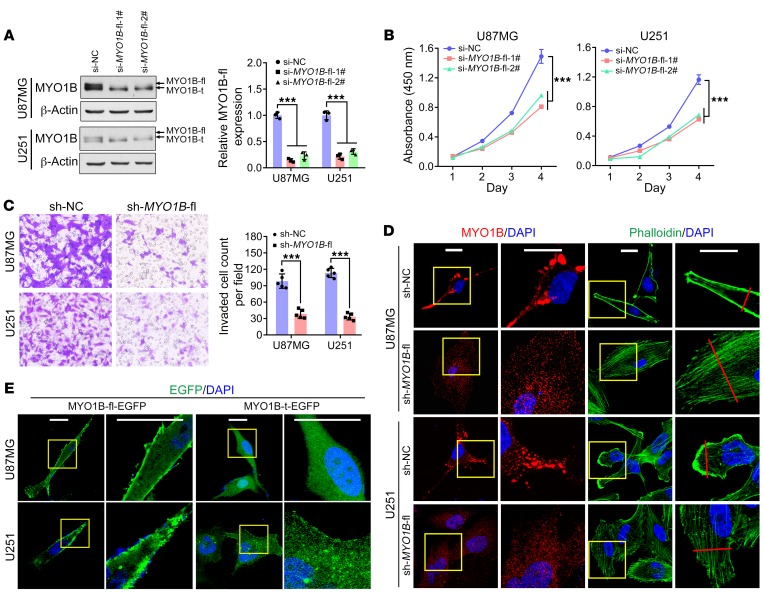
Figure 6. MYO1B-fl promotes GBM malignancy, and MYO1B isoforms differ in subcellular localization.
(A) Endogenous MYO1B-fl was efficiently knocked down in U87MG and U251 cells by MYO1B-fl siRNA (si-MYO1B-fl-1#, si-MYO1B-fl-2#) transfection, as verified by Western blot. Loading control: β-actin. (B) Growth curves of U87MG and U251 cells transfected with the siRNAs as indicated. (C) Transwell invasion assay results. Original magnification, ×400. (D) Fluorescence images of the cells as indicated. MYO1B was stained by immunofluorescence (red) and the cytoskeleton was labeled by phalloidin (green). Cell nuclei were counterstained with DAPI (blue). Scale bars: 20 μm. (E) Subcellular distribution of EGFP-fused MYO1B. Cell nuclei were counterstained with DAPI (blue). Scale bars: 20 μm. Data in A–C are presented as mean ± SD, n = 3 for A and n = 5 for B and C. ***P < 0.001 by 1-way ANOVA with Dunnett’s post test for A and B, 2-tailed Student’s t test for C. Representative images from triplicate biological experiments are shown for C and D.

