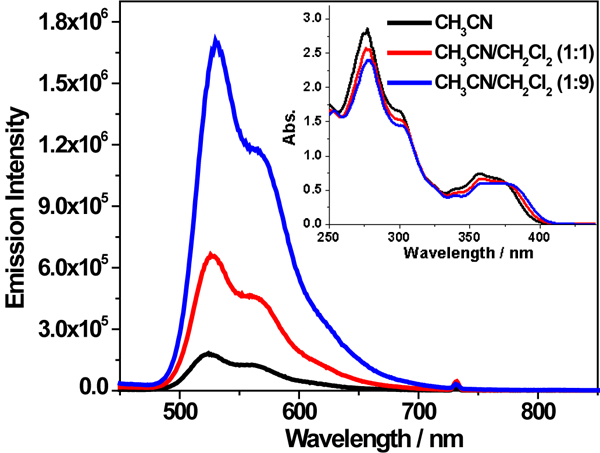
Figure 6.

Emission spectra of complex 2 in CH3CN/CH2Cl2 solutions with varied percentage of CH2Cl2. The concentration of each solution was 1×10⁻⁵ mol/L and λex = 370 nm. The inset is the UV-vis absorption spectra of the solutions used for the emission measurements.
