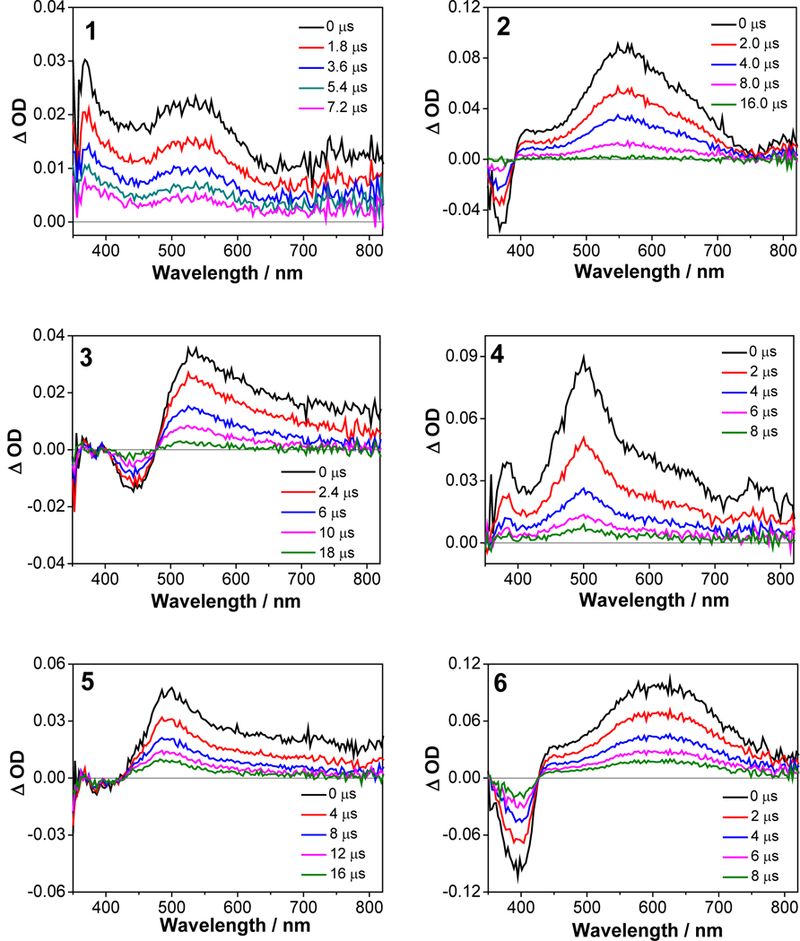
Figure 8.

Nanosecond time-resolved TA spectra of 1-6 in acetonitrile solution. λex = 355 nm, A355 = 0.4 in a 1-cm cuvette. The concentration of each sample solution was 7.2×10⁻⁵, 1.8×10⁻⁵, 1.9×10⁻⁵, 2.8×10⁻⁵, 3.1×10⁻⁵, and 2.0×10⁻⁵ mol•L−1 for 1-6, respectively.
