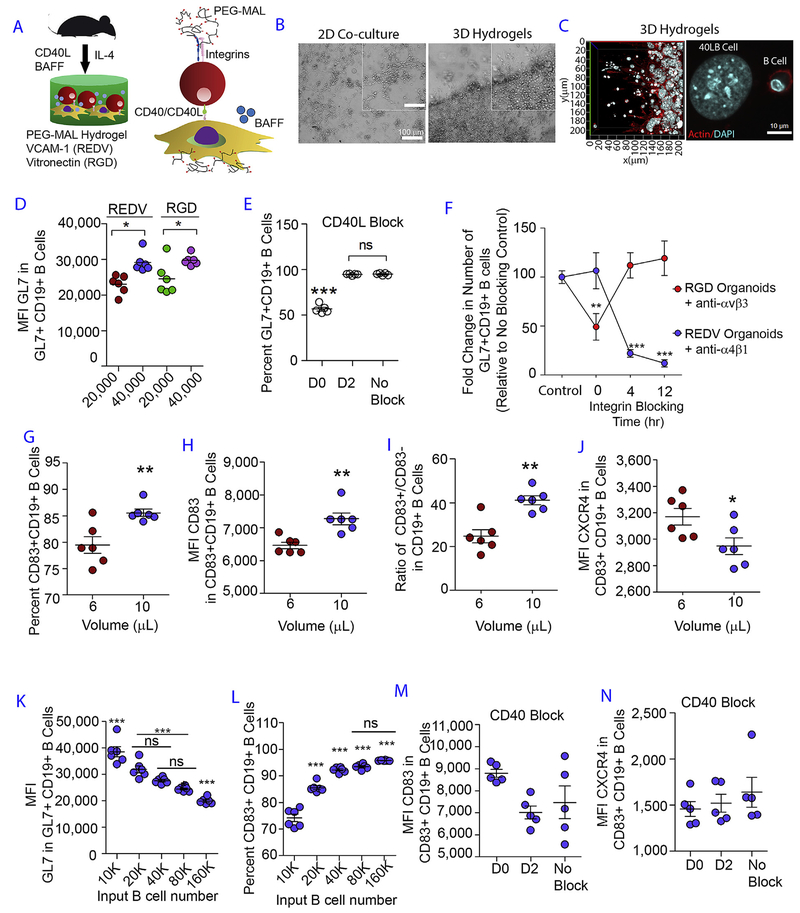
Fig. 1. Designer immune tissues control GC-like B cell phenotype.
A) Schematic showing PEG-MAL hydrogels functionalized with REDV or RGD peptides and embedded with naïve B cells and 40LB stromal cells in the presence of soluble IL-4 cytokine. B) Phase contrast images show qualitative distribution of B cells in 2D co-cultures (left) and 3D immune tissues (right). C) Confocal images of 40LB stromal cells and B cells in 3D immune tissues. D) Role of integrin ligand and 40LB density on GC induction. Scatter plot represents median fluorescent intensity of GL7 in GL7+CD19+ GC B cells as a function of integrin ligand VCAM-1 (REDV) and vitronectin (RGD), and 40LB cell density (20,000 vs. 40,000 40LB cells per 10 μL hydrogel). N = 6; Mean ± S.E.M; **P < 0.005, *P < 0.05; 2-way ANOVA with Bonferroni correction. E) Effect of blocking CD40L on GC induction. Scatter plot represents percentage GL7+ CD19+ GC-like B cells following culture in hydrogel functionalized with RGD in the presence of anti-CD40L antibody added at various time points in culture. N = 5; Mean ± S.E.M; ***P < 0.0001; 1-way ANOVA with Tukey’s post-hoc correction. F) Temporal dependency of integrin ligand interaction on GC B cells. Relative percentages of cells were quantified for GL7+ CD19+ GC-like B cells following culture in hydrogel functionalized with either REDV (blue) or RGD (red) in the presence of anti-α4β1 antibody or Cilengitide anti-αvβ3 peptide) added at various time points in culture. GL7+ CD19 + percentage was normalized to the no inhibitor treatment. N = 6; Mean ± S.E.M; Statistical significance was tested based on p < 0.05 using 2-way ANOVA with Bonferroni correction. ***P < 0.0001, **P < 0.001. Control: No inhibitor. G) The percentage of CD83 + CD19 + B cells as a function of hydrogel volume. Immune tissues, encapsulating 40,000 B cells and 40,000 40LB cells, were cultured for 4 days in media containing 10 ng/mL IL-4. H) CD83 surface expression level in CD83 + CD19 + GC B cells as a function of hydrogel volume, cultured for 4 days. I) CD83 + CD19 + and CD83−CD19 + B cells as a function of hydrogel volume, cultured for 4 days. J) CXCR4 surface expression level in CD83 + CD19 + GC B cells as a function of hydrogel volume, cultured for 4 days. K-L) GL7 expression in GL7+ CD19+ GC-like B cell population and the percentage of CD83 + CD19 + GC B as a function of B cell seeding density in 10 μL PEG-MAL hydrogel, cultured for 4 days. ***P < 0.0001, **P < 0.001, *P < 0.05; 1 Way ANOVA with Tukey’s Test. Values are shown as mean ± SEM (n = 5). M-N) CD83 and CXCR4 expression level based on median fluorescence intensity (MFI) in CD83 + CD19 + B cell population following 4-day culture in RGD hydrogel with the addition of anti-CD40L antibody to block CD40 signaling at day 0 (D0) and day 2 (D2). Control group was prepared with no blocking performed (No Block). Statistical significance was tested based on p < 0.05 using 1-way ANOVA with Tukey’s test (N = 5; Mean ± S.E.M). (For interpretation of the references to color in this figure legend, the reader is referred to the Web version of this article.)

