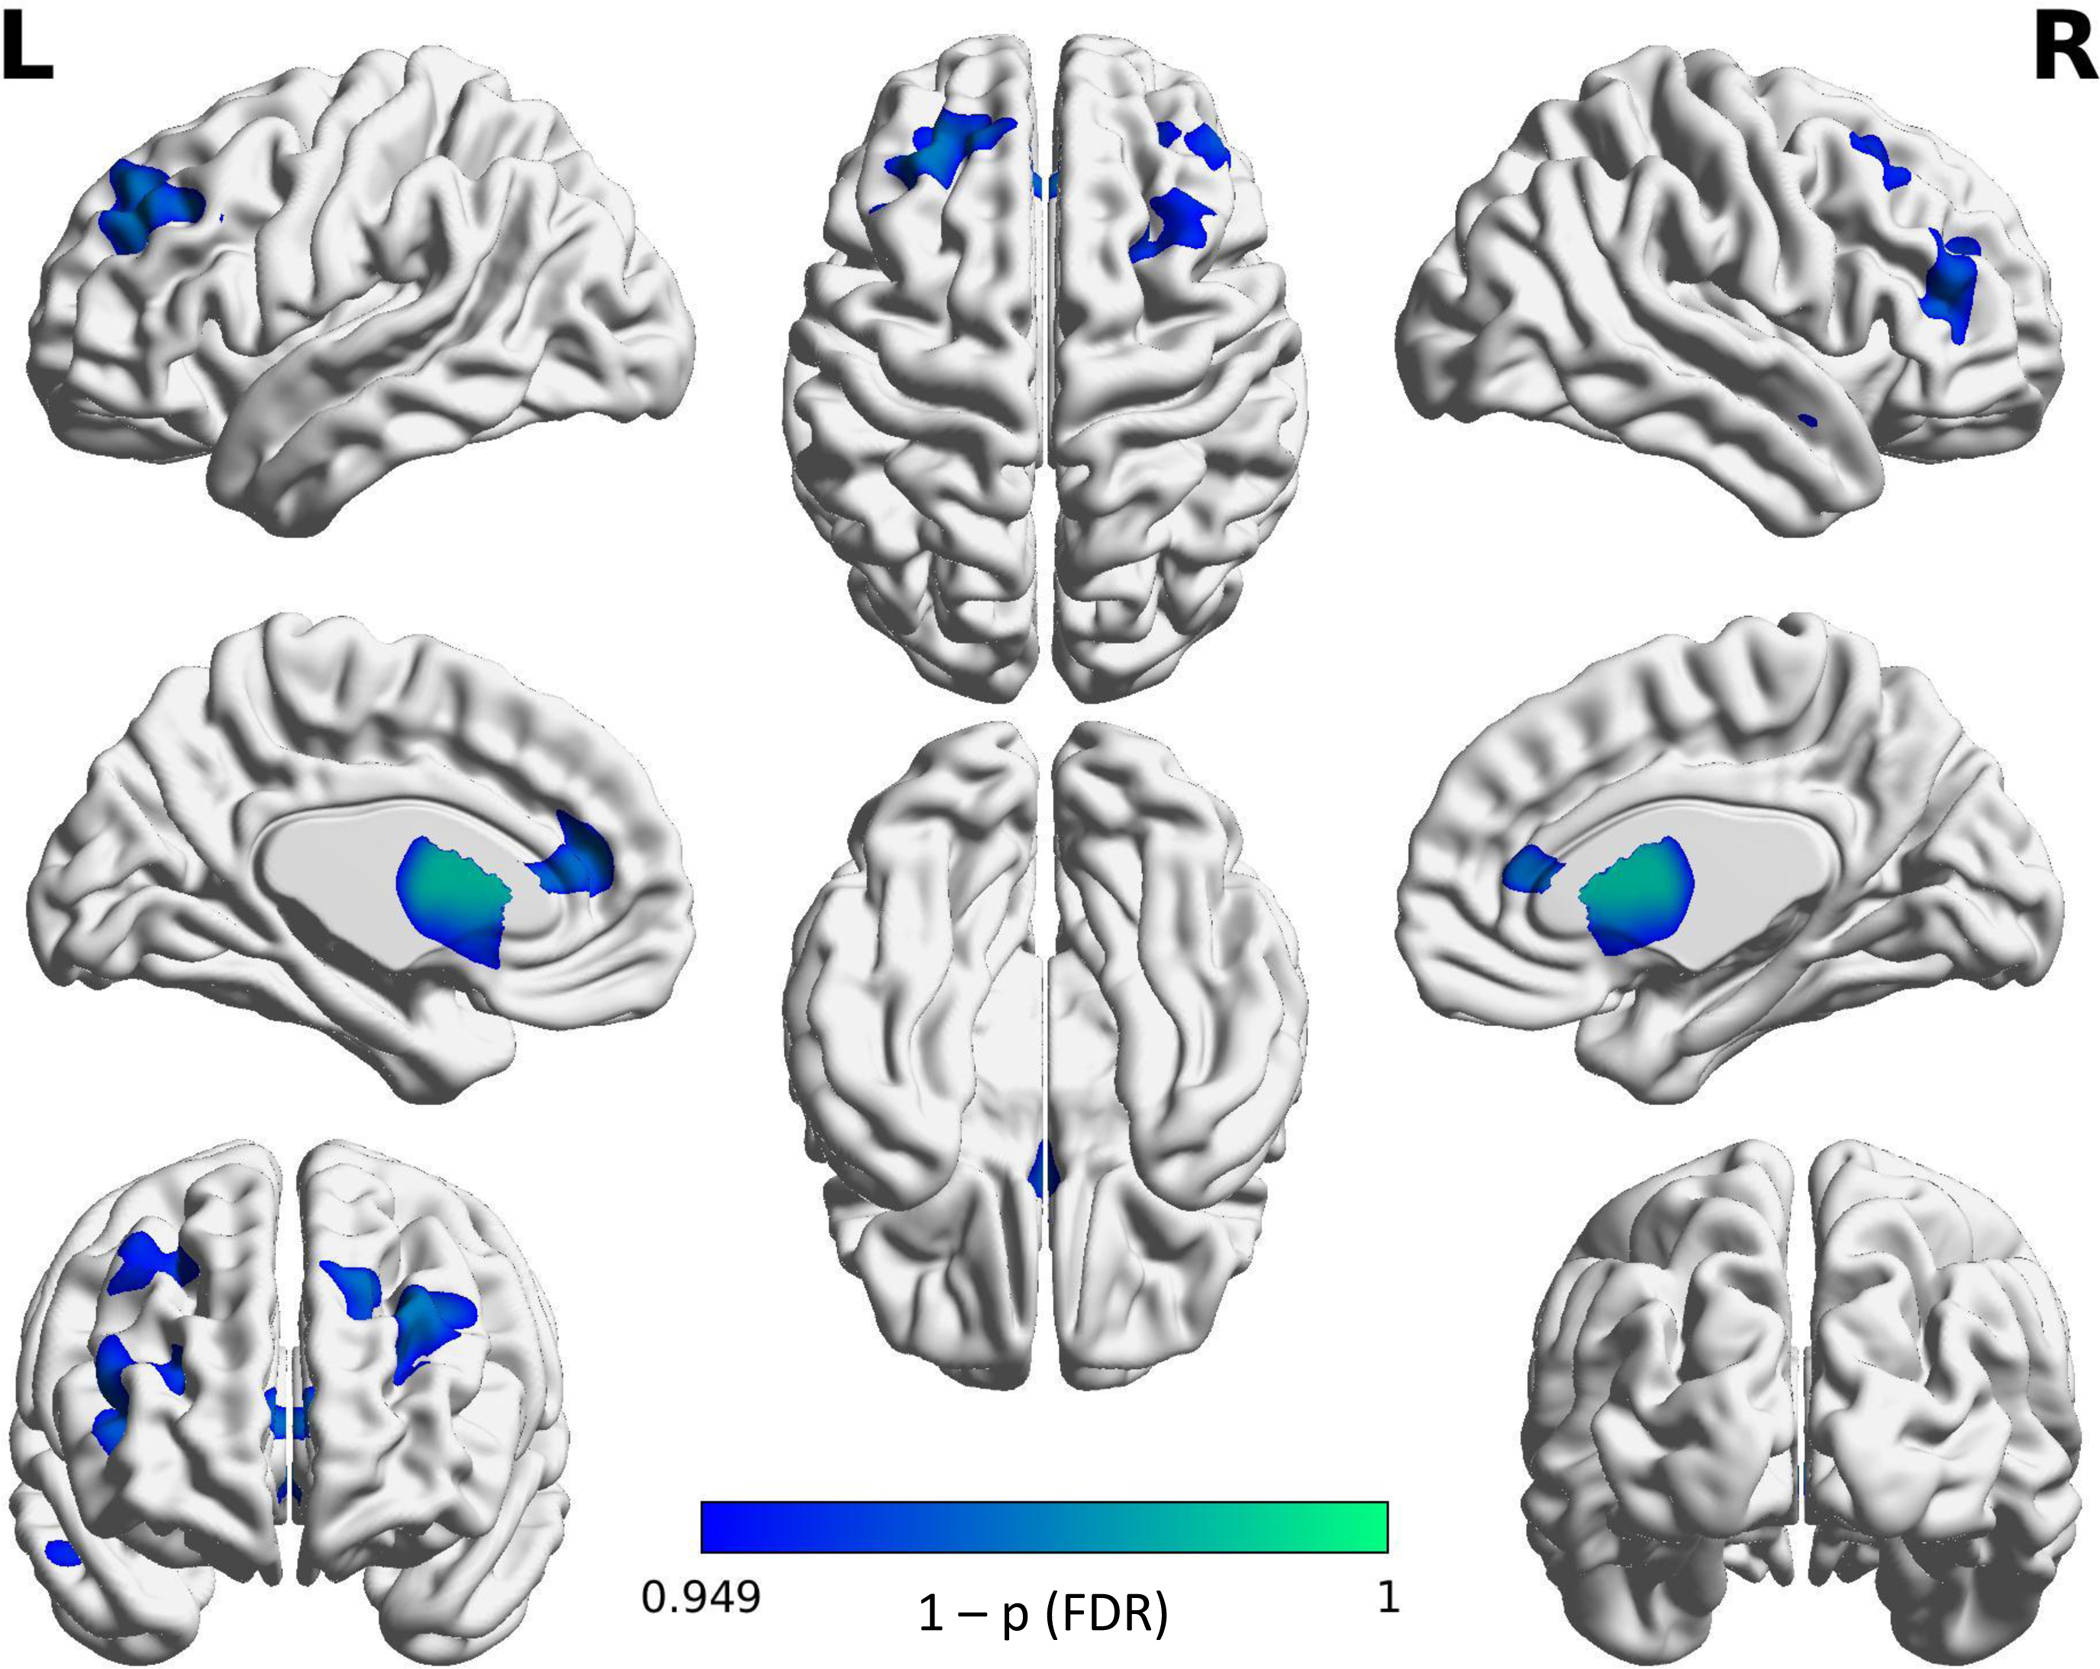
Figure 1: GM differences between IBS and HC in the Combined Sample.

IBS < HC contrast shows regions in IBS that were significantly lower in GMV than in the HC.
Projected color map displays FDR corrected “1-p” values.
The combined sample shows IBS patients having lower gray matter volume in multiple regions of the brain including the dorsolateral prefrontal cortex (dlPFC), anterior mid-cingulate cortex (aMCC), thalamus and basal ganglia. Color map represents “1-p” values with lighter values being closer to 1. All results shown are significant at p(FDR) < .05.
