
Figure 4:
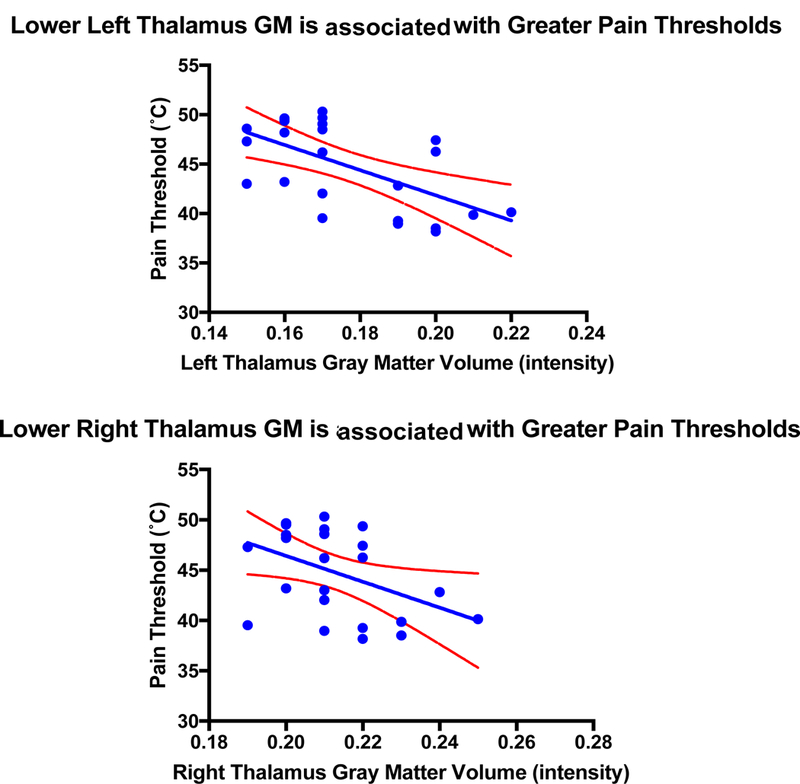
UCLA Sample – Lower GMV in the Thalamus bilaterally (Left: r = −.62, p = .001, p(FDR) = 0.008; Right: r = −.51, p = .01, p(FDR) = 0.04) is associated with increased pain thresholds. Blue lines represent line of best fit and red dotted lines represent 95% confidence intervals.