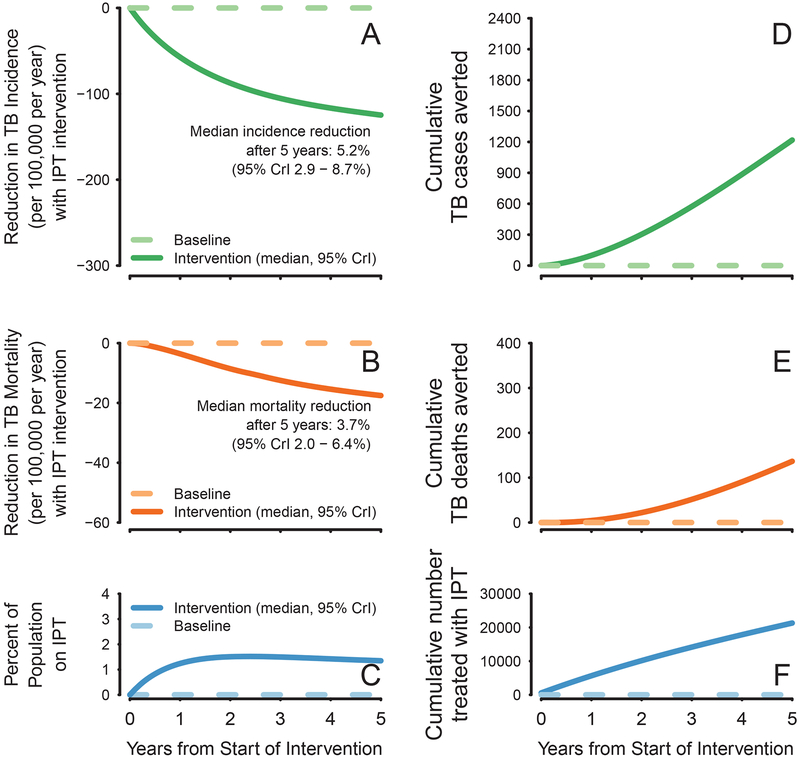
Figure 2. Population Level Impact of IPT.
Panels A and B illustrate the median and 95% credible interval of reductions in incidence (green), reductions in TB mortality (orange), and people treated with IPT (blue) in the IPT intervention scenario, both at any given time (A-C) and cumulatively over 5 years of IPT program implementation (D-F), in the Khayelitsha population of 392,000 with TB incidence and TB mortality of 2408 (95\% CrI 2170–2622) and 490 (95%CrI 345–517), respectively.

