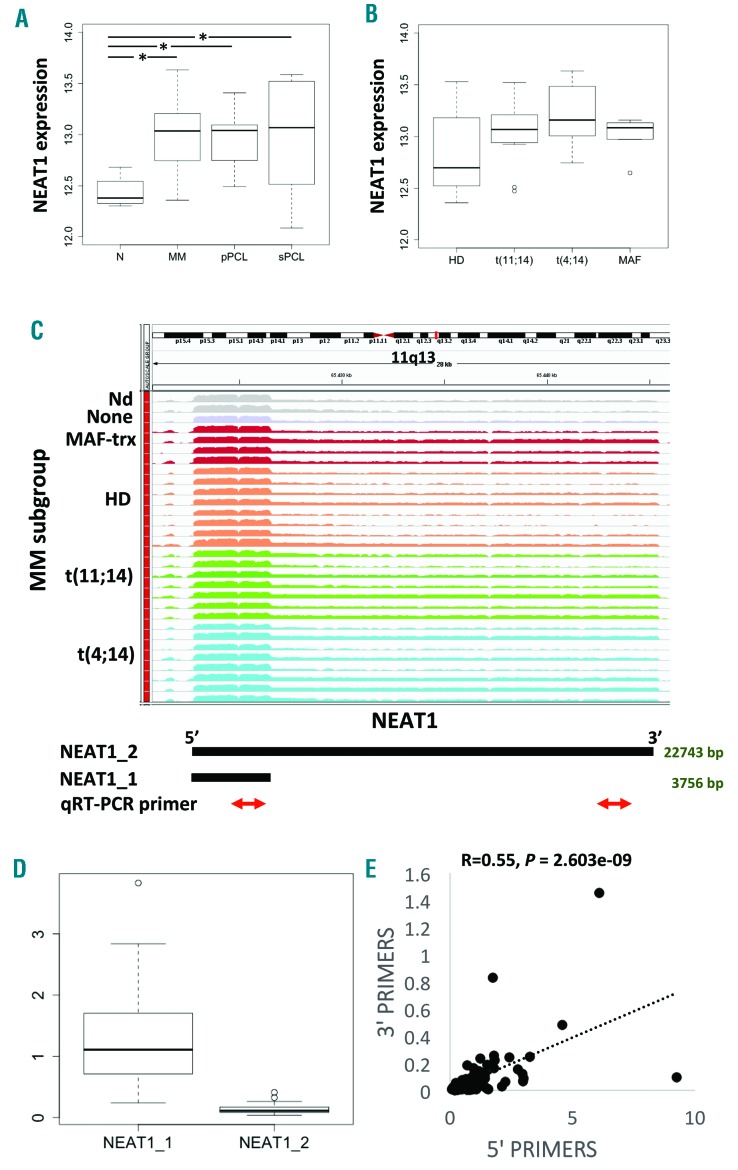
Figure 1.
NEAT1 expression by GeneChip® Human Gene 2.0 ST arrays. (A) Boxplot of NEAT1 expression shows a significant upregulation in pathological multiple myeloma (MM), primary plasma cell leukemia (pPCL) and secondary PCL (sPCL) samples as compared with healthy control based on Dunn test; *P<0.01. (B) Boxplot of NEAT1 expression does not show any significant correlation with group membership defined by t(11;14), t(4;14), MAF translocation, and hyperdiploid status. (C) NEAT1 expression by RNA sequencing. Visualization of RNA-seq data: zoomed view of the NEAT1 lncRNA region; the coverage bigWig files generated using bamCoverage function in deeptools (http://deeptools.readthedocs.io/en/latest/content/tools/bamCoverage.html) and the human genome annotation file (GENCODE v.25) were loaded into the Integrated Genome Viewer (IGV) (http://www.broadinstitute.org/igv/). The y-axis shows the scaled number of reads mapping to each location of the genome in the NEAT1 region (x-axis) schematically reported below together with qRT-PCR primers. Each lane represents a MM patient: different colors refer to the sample molecular characteristic indicated at the left. In order to compare samples, coverage values from all patients were group-scaled. (D) Boxplot of NEAT1_1 and NEAT1_2 expression by RNA-seq showing that the shorter transcript is expressed approximately 10-fold higher than the longer isoform. Transcript abundance was estimated as Fragments Per Kilobase per Million mapped reads (FPKM). (E) Pearson analysis correlating NEAT1 total expression (x-axis) with the long transcript expression (y-axis). Correlation coefficient R and significant P-value are reported. HD: hyperdiploid.

