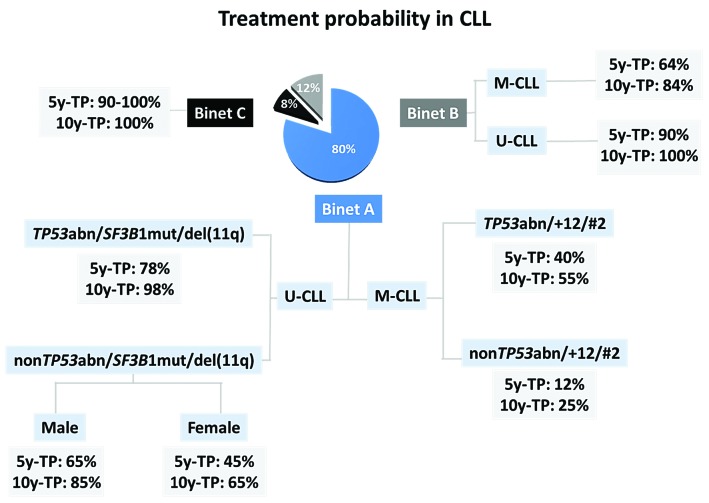
Figure 7.
Prognostic algorithm regarding treatment probability for chronic lymphocytic leukemia (CLL). 5y-TP: treatment probability five years from diagnosis; 10y-TP: treatment probability ten years from diagnosis; U-CLL: CLL with unmutated IGHV genes; M-CLL: CLL with mutated IGHV genes; TP53abn: deletion of chromosome 17p (del(17p)) and/or TP53 mutation; +12:trisomy 12, del(11q): deletion of chromosome 11q; SF3B1mut: SF3B1 mutation; #2: assignment to stereotyped subset #2. The pie chart refers to the entire cohort with each slice indicating the proportion of patients according to Binet clinical staging.

