
FIG 3.
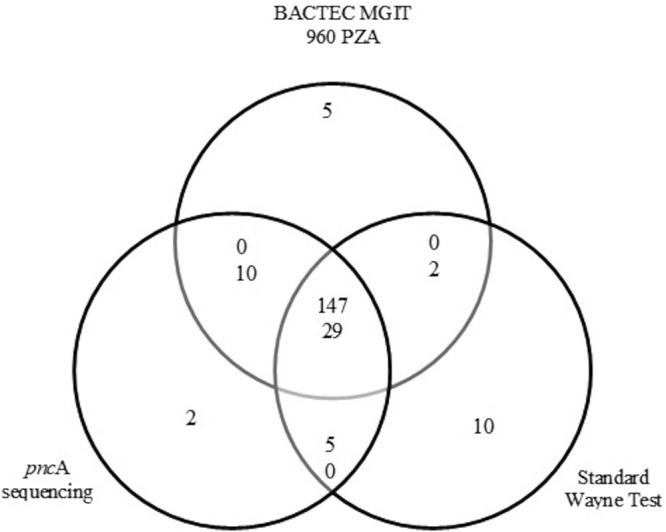
Sample distribution by PZA susceptibility profile. Distribution displayed according to the results from Bactec MGIT 960 PZA, pncA sequencing, and classic Wayne test. For stacked numerals, the number of PZA-susceptible isolates is given above the number of PZA-resistant isolates.