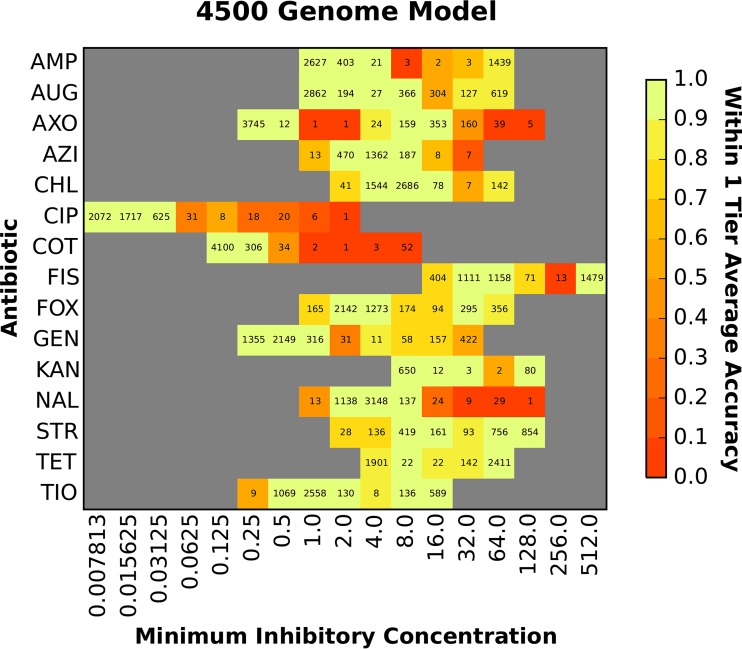
FIG 3.
Accuracy of the MIC prediction model based on 4,500 diverse genomes. The heat map depicts the accuracy within ±1 2-fold dilution step of the laboratory-derived MIC. The x axis shows the MIC (in micrograms per milliliter), and each antibiotic is shown on the y axis. The accuracy for each antibiotic-MIC combination is depicted by color, with bright yellow/green being the most accurate and red being the least accurate. The values shown in each cell are the number of genomes with that MIC for a given antibiotic.

