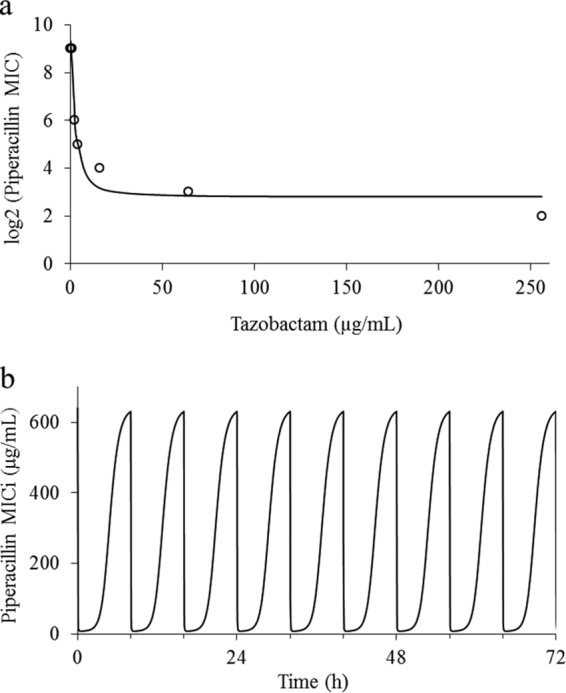
FIG 1.

Representative model fit and instantaneous MIC profile. Model fit to piperacillin MIC data for Kp3 in the presence of escalating tazobactam concentrations (r2 = 0.94) (a). Open circles indicate experimental data, and the continuous line represents the best-fit model. MICi profile using 0.5 g tazobactam every 8 h is shown (b).
