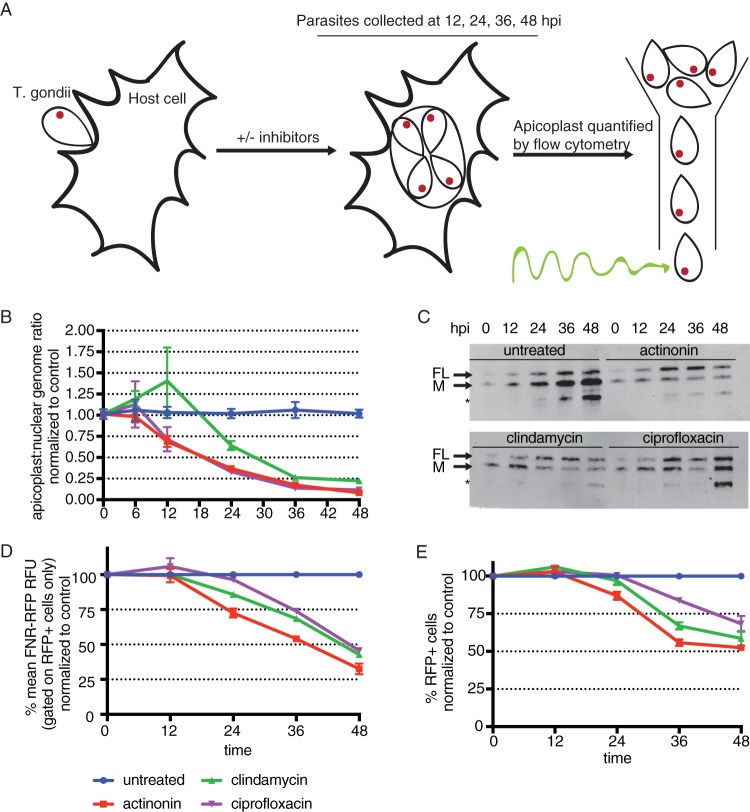
FIG 2.
Apicoplast loss occurs gradually over the first lytic cycle of treatment. (A) Schematic of the experimental procedure. T. gondii parasites are allowed to infect host cells and grow in the presence or absence of apicoplast inhibitors. At 6, 12, 24, 36, or 48 h, parasites are manually released from host cells. Because host cell lysis occurs between 36 and 48 h, parasites analyzed at these time points may reflect growth in the second lytic cycle. hpi, hours postinfection. (B) Apicoplast/nuclear genome ratios at all time points. Data are representative of results from two biological replicates performed in technical triplicate. Error bars represent the SEM. (C) Western blotting of TgCpn60 from 12 to 48 h. FL indicates the full-length protein prior to transit peptide cleavage. M indicates the mature protein after import into the apicoplast and transit peptide cleavage. The asterisk designates a probable cross-reacting signal (26). Data are representative of results from two biological replicates. (D) Mean FNR-RFP florescence of parasites with detectable FNR-RFP florescence, normalized to values for control untreated parasites, from 12 to 48 h. Data are representative of results from two biological replicates. Error bars represent the SEM. (E) Percentages of cells with detectable FNR-RFP fluorescence, normalized to values for control untreated parasites, from 12 to 48 h. Data are representative of results from two biological replicates. Error bars represent the SEM.

