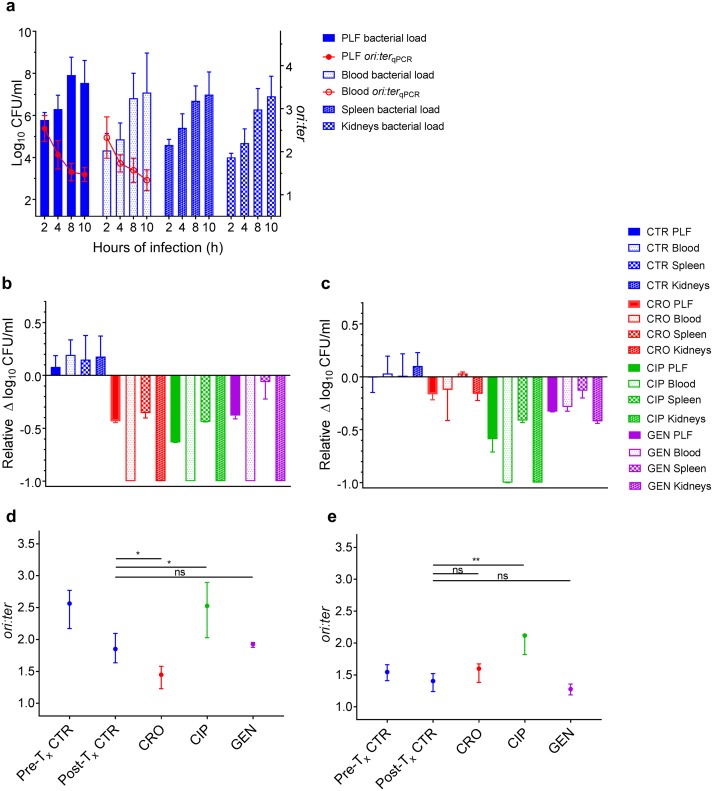
FIG 3.
Antibiotic activity as a function of bacterial growth rate during infection in vivo in the mouse peritonitis model. (a) Bacterial counts (CFU/ml; n = 9 per time point) and growth rates (ori:ter; 2, 8, and 10 h of infection, n = 9; 4 h of infection, n = 6) in untreated control groups (ATCC 25922 and ALO 4783) in the peritoneal lavage fluid (PLF), blood, spleen, and kidneys (bacterial counts only in the tissues). (b) Bacterial count reductions in PLF, blood, spleen, and kidneys after 2 h of antibiotic exposure in ceftriaxone (CRO), ciprofloxacin (CIP), and gentamicin (GEN) treatment groups when therapy was induced during rapid bacterial growth (i.e., at 2 h of infection). Controls (CTR) received no antibiotic therapy. (c) Bacterial count reductions in PLF, blood, spleen, and kidneys after 2 h of antibiotic exposure in treatment groups when therapy was induced during slow bacterial growth (i.e., at 8 h of infection). CTR received no antibiotic therapy. For comparison of activities between treatment induction during rapid and slow growth, data in panels b and c are presented as relative bacterial count reductions. CTR, n = 9; CRO, CIP, and GEN, n = 3. (d) Bacterial growth rates (ori:ter) in pretreatment controls (Pre-Tx CTR) and posttreatment controls (Post-Tx CTR) (i.e., at 2 and 4 h of infection, respectively) and in treatment groups after 2 h of antibiotic exposure when treatment was induced during rapid bacterial growth. As there was no significant difference in ori:ter values between control bacterial populations from PLF and blood, these were pooled for analysis. ori:ter values in treatment groups were only available from PLF, due to total bacterial elimination from the blood. Pretreatment CTR, n = 18; posttreatment CTR, n = 12; CRO, n = 3; CIP, n = 3; GEN, n = 3. (e) Bacterial growth rates (ori:ter) in Pre-Tx CTR and Post-Tx CTR (i.e., at 8 and 10 h of infection, respectively) and in treatment groups after 2 h of antibiotic exposure when treatment was induced during slow bacterial growth. PLF and blood ori:ter values were pooled for analysis. Pretreatment CTR, n = 18; posttreatment CTR, n = 18; CRO, n = 6; CIP, n = 3; GEN, n = 6. Data in panels b to e are presented as medians and interquartile ranges (IQRs). *, P < 0.05; **, P < 0.01; ns, P > 0.05 by Mann-Whitney U test.

