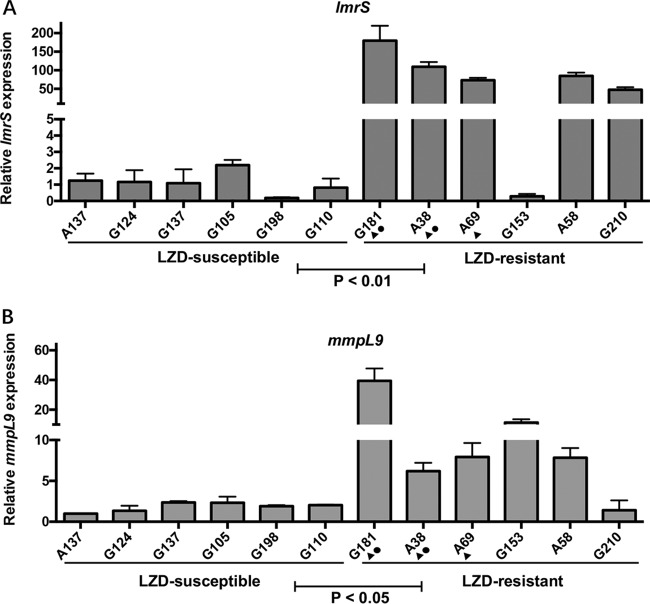
FIG 2.
qRT-PCR analysis of transcript levels of lmrS (A) and mmpL9 (B). Error bars represent the standard errors of each data point. A t test was used to test the differences among groups. Triangles (▲) indicate the strains whose LZD MIC decreased 4-fold after treatment with the inhibitor PAβN. Circles (●) indicate the strains whose LZD MIC decreased 4-fold after treatment with the inhibitor reserpine.

