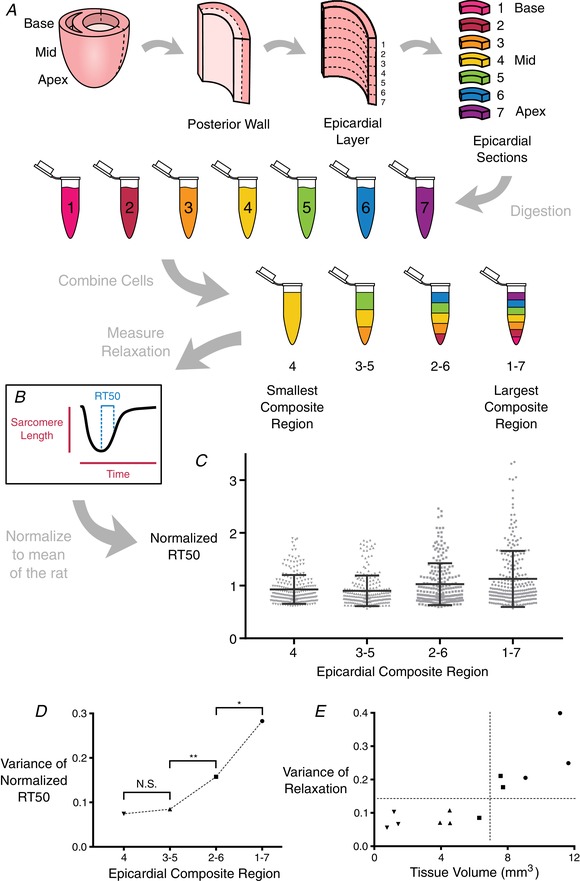
Figure 2. Cardiomyocyte isolation process to create composite regions and examine their RT50 variability.

A, whole hearts were removed from adult female rats and cannulated for Langendorff perfusion. The left ventricular free wall was excised, then further dissected to leave only the epicardial layer. The epicardial layer was then segmented from apex to base into seven equally‐sized sections, and each section was subjected to additional enzymatic digestion to release individual cardiomyocytes. The cells from these sections were then combined in equal proportions to form composite regions of cells, where the largest composite region (composite region 1–7, or CR1–7) consisted of cardiomyocytes from each of the seven sections, and the smallest composite region (CR4) consisted of only cardiomyocytes from the innermost section. B, sarcomere length shortening and calcium transient records were taken from ∼80 cells from each composite region from each of three rats. C, RT50 values were normalized across animals and plotted together to compare the distribution of values within each composite region. Bars indicate the SD in each group. D, variance of normalized RT50 values from each CR was compared with those of CRs immediately larger or smaller (Levene's test for equality of variance); * P ≤ 0.05, ** P ≤ 0.001. The RT50 variances of CR3–5 and CR4 were not different. E, variance of RT50 for each CR can be plotted as a function of the volume of cardiac tissue from which the CR was obtained, highlighting the myocardial volume below which variation ceases to diminish. [Color figure can be viewed at wileyonlinelibrary.com]
