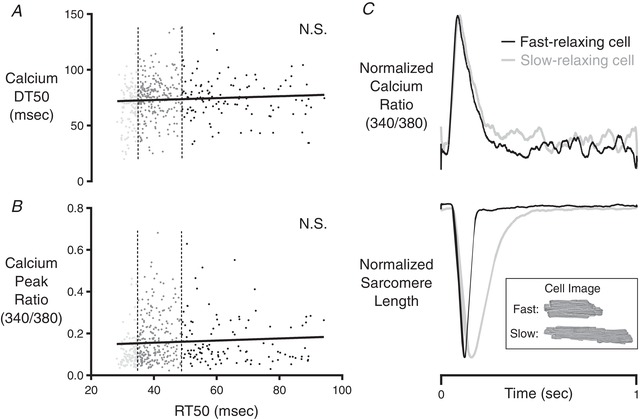
Figure 4. Correlation analysis of calcium parameters among cells isolated from CR3–5 and CR4 .

The first quartile (fast‐relaxing delineation) and third quartile (slow‐relaxing delineation) of RT50 values are indicated by the vertical dashed lines. Neither Ca‐DT50 (A), nor the peak fluorescence ratio (B) of the Fura‐2 Ca2+ indicator was correlated with RT50. C, representative records showing independence of RT50 from the shape of the intracellular calcium transient. These records were obtained in fast‐relaxing and slow‐relaxing cells within CR4 of the same rat. The normalized Ca2+ transients of these two cells were almost identical, yet their relaxation behaviours were strikingly different. The inset shows bright‐field images of the cells from which these records were taken.
