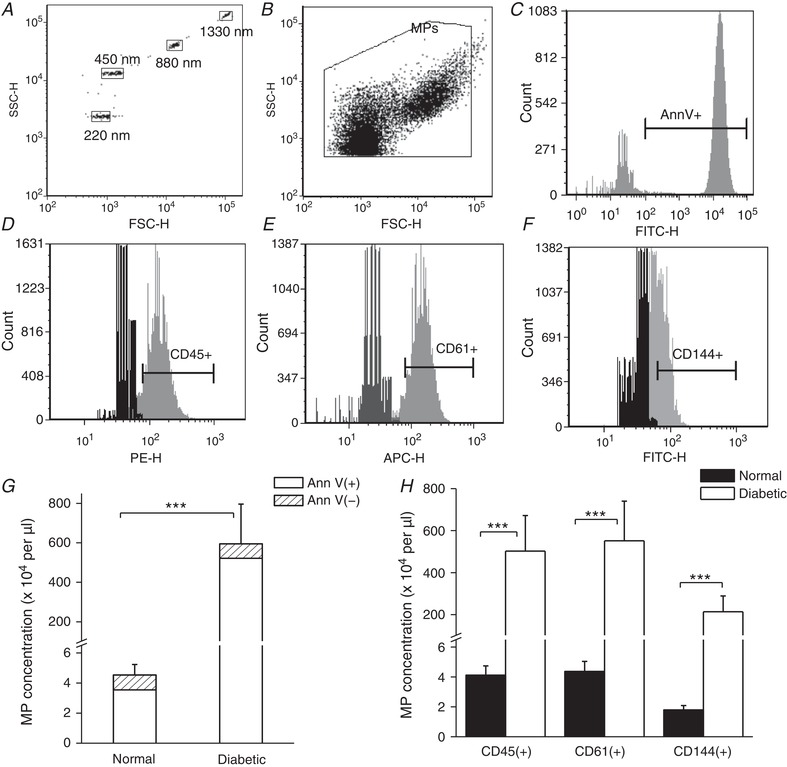
Figure 1. Flow cytometry analysis of microparticles (MPs) in rat plasma.

A, polystyrene calibration beads with diameters of 220, 450, 880 and 1330 nm were used for forward scatter (FSC) and side scatter (SSC) calibration. B, representative dot plot of gated particles in normal rat plasma with forward scatter (FSC) on the x‐axis (proportional to particle size) and side scatter (SSC) on the y‐axis (proportional to the particle granularity); both axes are in log‐scale. C, representative histogram showing FITC‐conjugated annexin‐V (AnnV) positive particles. The positive MP fluorescence intensity range is indicated by the horizontal bar. D–F, flow cytometry detection of MPs labelled with fluorescence‐conjugated cell marker specific antibodies showing MPs originated from leukocytes (CD45+), platelets (CD61+) and endothelial cells (CD144+). Gates were set up using fluorescence minus one (FMO) controls (shown in black). G, summary graph of flow cytometry analyses for plasma MPs showing that the total number of MPs dominated by AnnV‐positive (phosphatidylserine exposed) MPs was significantly increased in diabetic rats compared to normal rats. (N = 8 for each group, *** P = 0.0002). H, the cell origin characterization of MPs from the same samples shown in G demonstrates that the majority of the increased MPs in plasma of diabetic rats are derived from leukocytes, platelets and endothelial cells (*** P ≤ 0.001, N = 8 per group).
