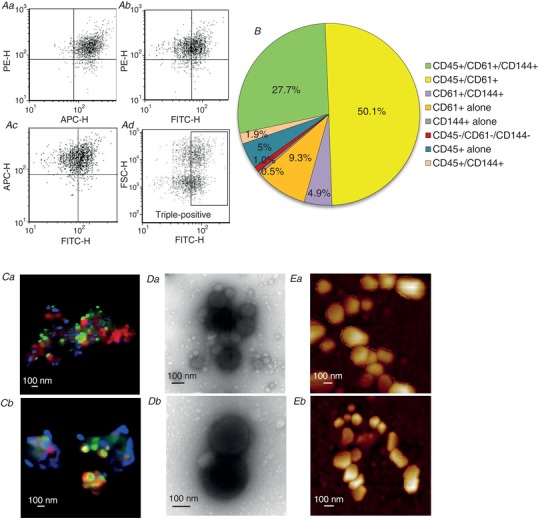
Figure 2. A majority of MPs express multiple cell markers indicating that MPs derived from different cell origins aggregate in the circulation.

A and B, flow cytometry analysis of diabetic rat plasma showing that 85% of MPs express triple and double cell markers (N = 8). C–E, morphology studies of plasma MPs in diabetic rats using confocal microscopy (Ca and b), transmission electronic microscopy (TEM) (Da and b), and atomic force microscopy (AFM) (Ea and b). Confocal imaging demonstrated that the aggregated MPs are from different cellular sources, which were identified by antibodies directed against specific cell markers: platelets (CD61, red), leukocytes (CD45, blue). The MPs were also aggregated with lipid droplets (bodipy, green). TEM and AFM confirmed the aggregated form of MPs in the plasma. N = 3–4 per approach.
