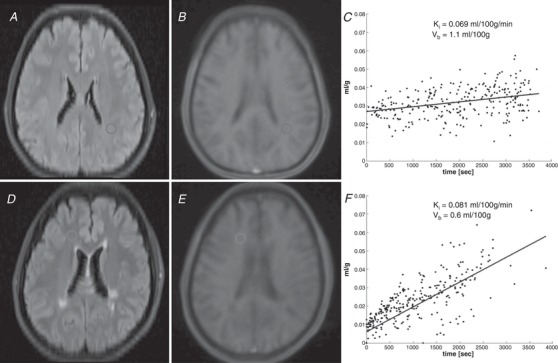
Figure 1. Region of interest (ROI) placement and Patlak plots.

A, axial fluid‐attenuated inversion recovery sequence (FLAIR) in a control subject with manual ROI placement in the normal‐appearing white matter. B, first dynamic frame from the same subject, with ROI transposed. C, Patlak plot derived from the ROI. D–F, same images for a subject with relapsing–remitting multiple sclerosis. ‘Time’ in the x‐axis of the Patlak plots is normalized to arterial concentration.
