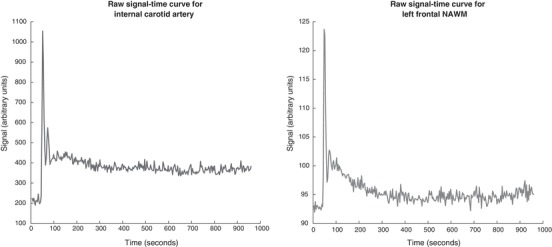
Figure 2. Representative signal‐time curves.

A, maximal signal change in the internal carotid arterial input function. B, mean behaviour of voxels from a tissue ROI in normal‐appearing white matter (NAWM). Both curves are from the same subject in Fig. 1 D–F.
