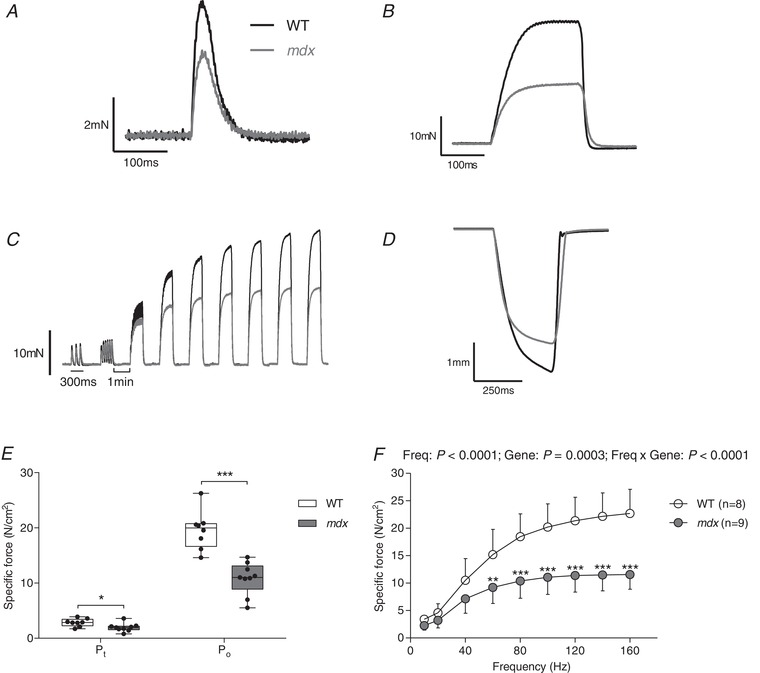
Figure 1. Ex vivo wild‐type and mdx diaphragm muscle contractile function.

A–D, original traces of ex vivo diaphragm muscle twitch contraction (A), tetanic contraction (B), force–frequency relationship (C) and maximum unloaded shortening (D) for wild‐type (WT) (black) and mdx (grey) preparations. E, group data for diaphragm muscle twitch (P t) and tetanic (P o) force in WT (n = 8) and mdx (n = 9) mice. Tetanic force was measured following stimulation at 100 Hz ex vivo. Values are expressed as box and whisker plots (median, 25–75th percentile and scatter plot). Data were statistically compared by unpaired Student's t tests. * P < 0.05 and *** P < 0.001 compared to the corresponding WT value. F, group data (mean ± SD) for diaphragm muscle force–frequency relationship ex vivo in WT (open) and mdx (grey) preparations. Data were statistically compared by repeated measures two‐way ANOVA (frequency × gene) followed by a Bonferroni post hoc test. ** P < 0.01 and *** P < 0.001 compared to the corresponding WT value.
