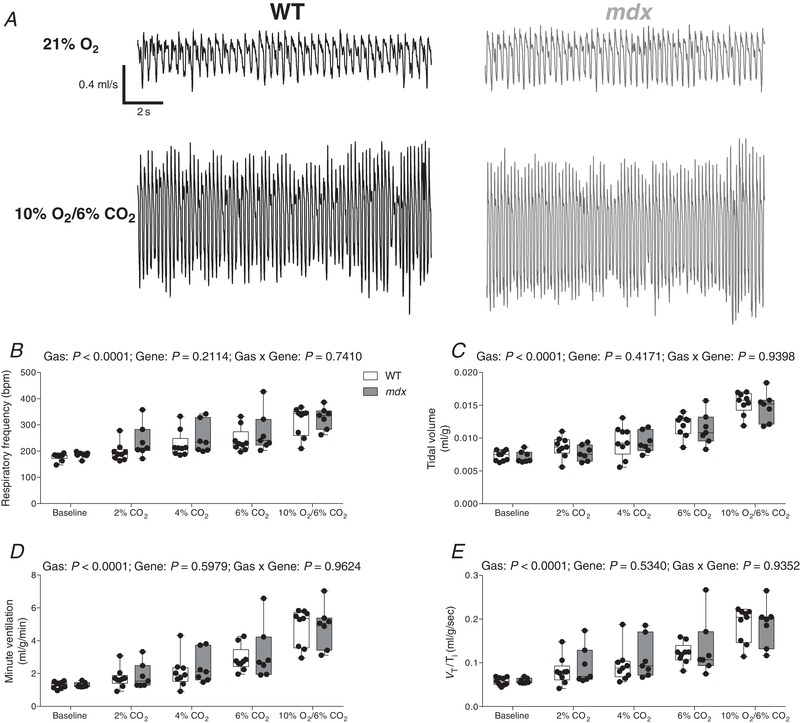
Figure 2. Ventilation in response to chemostimulation in conscious wild‐type and mdx mice.

A, representative respiratory flow traces during normoxia (21% O2) and hypercapnic hypoxia (10% O2/6% CO2) in a wild‐type (WT) (black) and mdx (grey) mouse; inspiration downwards. B–E, group data for respiratory frequency (B), tidal volume (C), minute ventilation (D) and mean inspiratory flow (E) (V T/T i) during graded hypercapnia (2%, 4% and 6% CO2) and hypercapnic hypoxia (10% O2/6% CO2). Values are expressed as box and whisker plots (median, 25–75th percentile and scatter plot). Data were statistically compared by repeated measures two‐way ANOVA.
