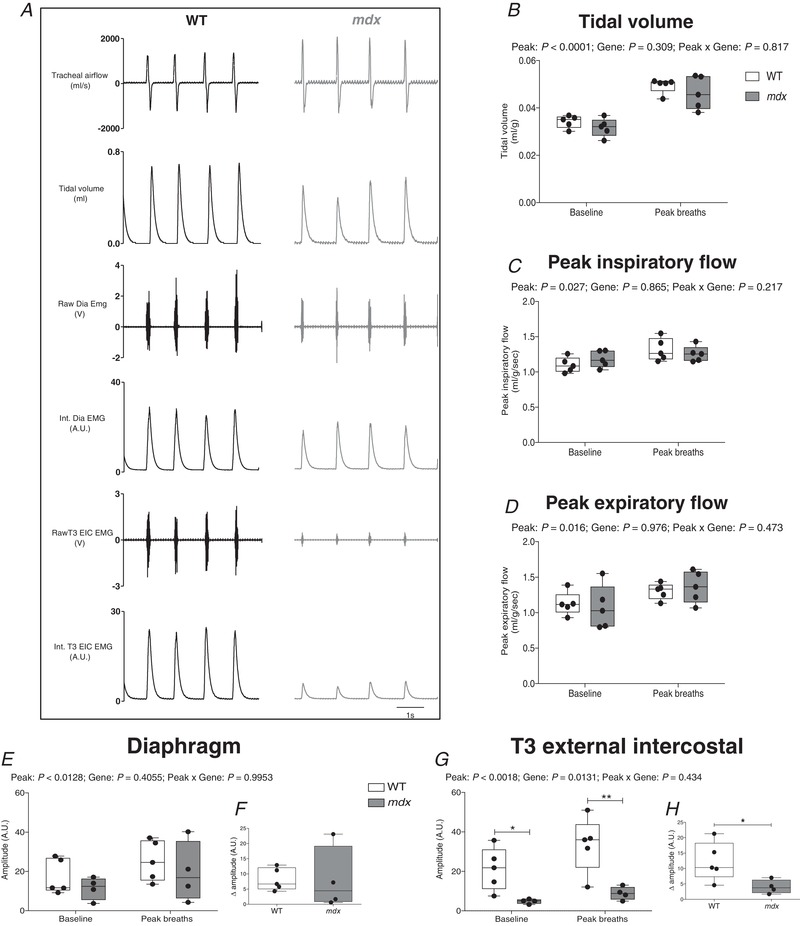
Figure 6. Tracheal airflow and diaphragm and EIC EMG activities in anaesthetized, vagotomized wild‐type and mdx mice.

A, representative recordings of tracheal airflow, tidal volume, raw and integrated (Int.) diaphragm (Dia) and T3 external intercostal (T3 EIC) EMG activities for an anaesthetized WT mouse (black) and mdx mouse (grey) during baseline conditions ( = 0.60). B–D, group data for tidal volume (B), peak inspiratory flow (C) and peak expiratory flow (D) during baseline conditions and during spontaneous peak breaths during chemoactivation ( = 0.15/ = 0.06). E, diaphragm EMG activity during baseline and peak breaths. F, diaphragm EMG response (expressed as absolute change from baseline amplitude) during peak breaths. G, EIC EMG activity during baseline and peak breaths. H, EIC EMG activity (expressed as absolute change from baseline amplitude) during peak breaths. Values are expressed as box and whisker plots (median, 25–75th percentile and scatter plot). Data were statistically compared by repeated measures two‐way ANOVA or two‐tailed unpaired Student's t tests. * P < 0.05 and ** P < 0.01 compared to the corresponding WT values.
