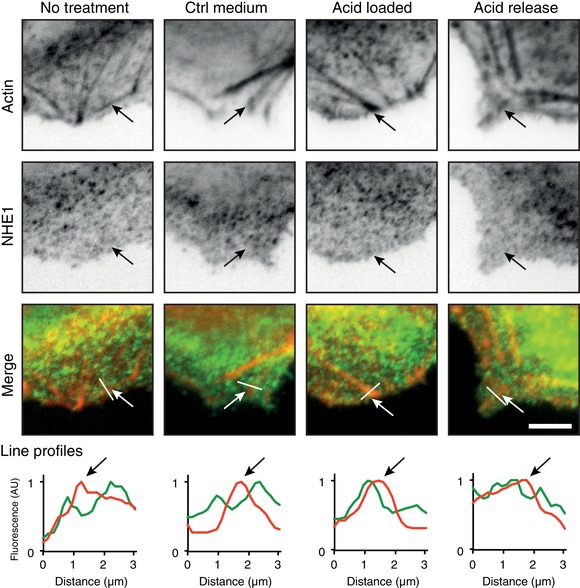
Figure 3. NHE1‐GFP clusters localized to actin in acid loaded cells.

Subconfluent NHE1‐MDCK cells were acid loaded by a 20 mm NH4Cl prepulse in Ringer solution followed by NH4Cl removal to stimulate NHE1 activity. Cells were fixed and stained with phalloidin‐rhodamine to label actin and subsequently imaged using TIRF microscopy. Line profiles show the relative intensities of red and green fluorescence along the indicated lines. Arrows indicate positions of actin in the images and on the line profiles. AU, arbitrary units. Scale bar = 5 μm. The images are representative of three individual experiments. [Color figure can be viewed at wileyonlinelibrary.com]
