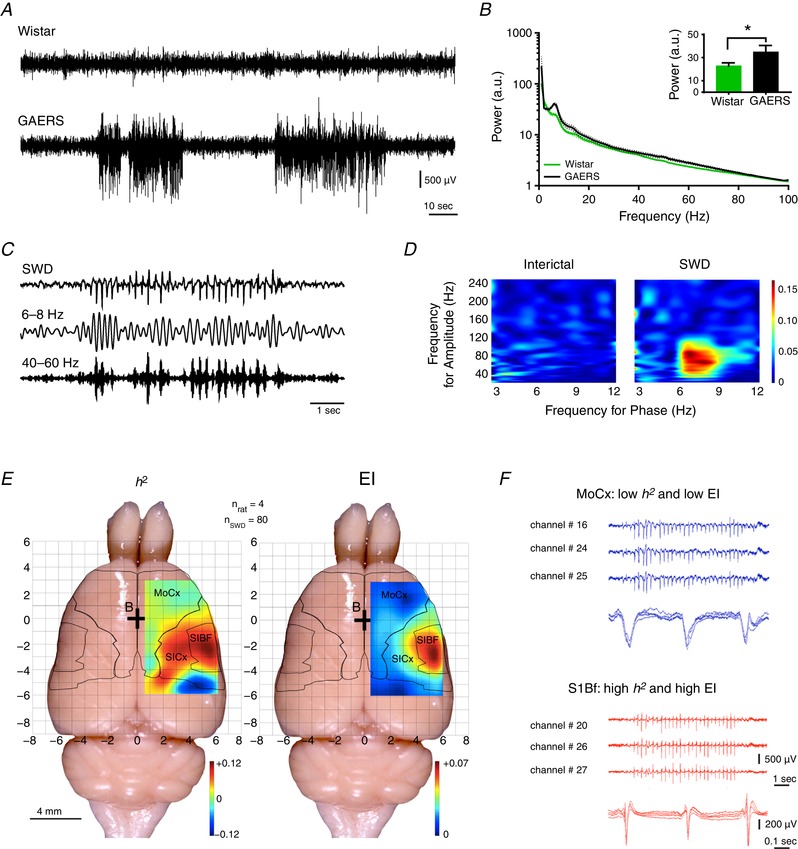
Figure 1. SWDs initiating zone localization in the S1Bf cortex.

A, examples of LFP recordings in the S1 cortex in freely moving Wistar rat (top) and GAERS (bottom). B, FFT power of 60 min LFP recordings in freely moving GAERS and Wistar (mean ± SEM; n = 4 per group). Inset: mean ± SEM 6–8 Hz power (n = 4 per group; * P ≤ 0.05, Mann–Whitney test). C, example of trace of a SWD recorded in the S1 cortex of a GAERS (top) filtered to highlight increased power in the 6–8 Hz (middle) and 40–60 Hz (bottom) frequency bands. D, example of phase–amplitude coupling maps of interictal and ictal (SWD) LFP recordings. E, h 2 (left) and EI (right) mean colour‐coded maps of 32‐contact FlexMEA recorded SWDs (rats, n = 4; SWDs, n = 80). F, raw trace examples of FlexMEA recordings in the motor cortex (MoCx, blue) and in the S1Bf (red) with each time an enlargement of three successive spike‐ and‐waves.
