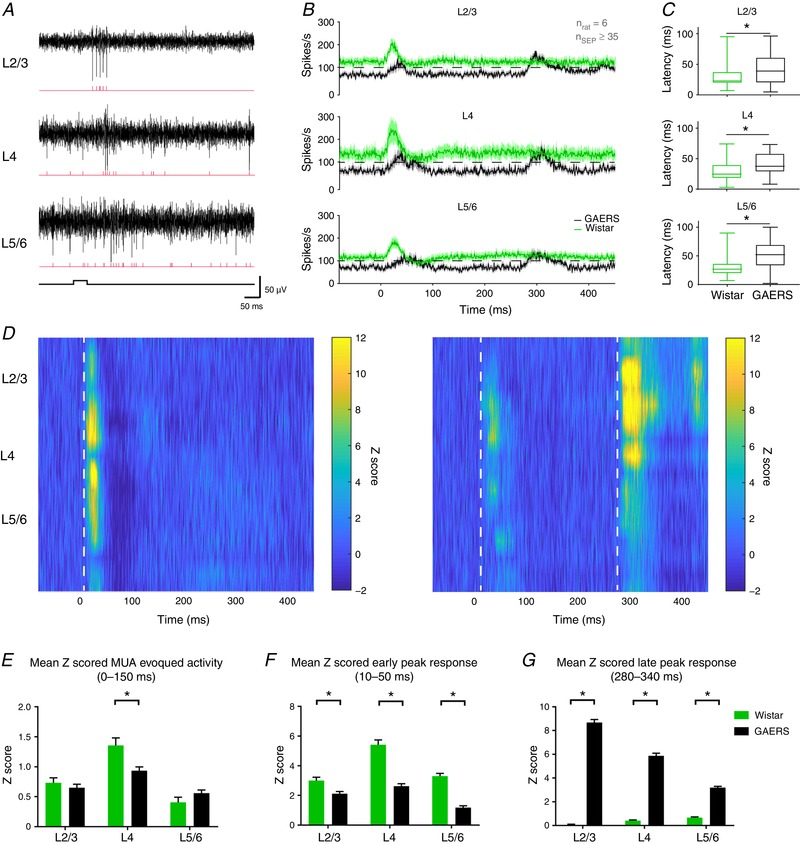
Figure 4. MUA‐evoked activity in the S1Bf cortex.

A, example traces of MUA (black) recorded in the S1Bf during whisker stimulation and corresponding raster plots (red). B, grand average PSTH among cortical layers. Dashed lines represent 100 spikes s−1. C, box plot distribution of MUA peak activation latency among cortical layers (* P ≤ 0.05, Mann–Whitney test). D, Z scored PSTH of MUA activity with respect to the cortical layers for Wistar (left) and GAERS (right). Dashed lines highlight the beginning of MUA‐evoked activity. E, quantification of the MUA‐evoked activity between 0 and 150 ms after the onset of air puff stimulation in Wistar (green) and GAERS (black). F, quantification of the MUA‐evoked activity activity between 10–50 ms after the onset of air puff stimulation in Wistar (green) and GAERS (black). G, quantification of the MUA‐evoked activity between 280 and 340 ms after the onset of air puff stimulation in Wistar (green) and GAERS (black) (mean ± SEM; n = 6 rats per group, n ≥ 35 SEPs per group; * P ≤ 0.05, Holm–Sidak test).
