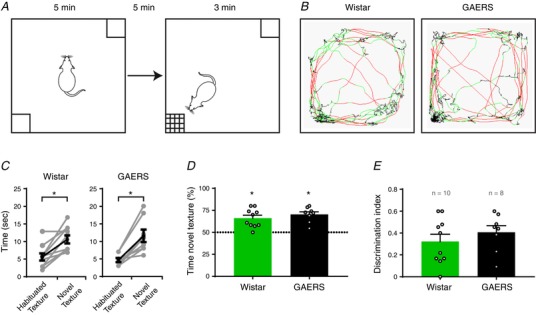
Figure 5. Texture discrimination evaluation.

A, schematic representation of the experimental design for the discrimination task. B, example traces of the locomotion of rats during the test (red: fast movements; green: slow movements; black: immobility). In these examples, the novel texture was in the bottom left. C, quantification of the exploration time for both textures during the test phase (each paired dot represents one rat; * P ≤ 0.05, Wilcoxon test). D, quantification of the percentage of time spent exploring the novel texture. Dashed line represents 50% chance (* P ≤ 0.05, Wilcoxon signed rank test against 50% chance). E, quantification of the index of discrimination (n.s., Mann–Whitney test) (mean ± SEM; n = 10 and 8 for Wistar (green) and GAERS (black), respectively; open circles represent one rat).
