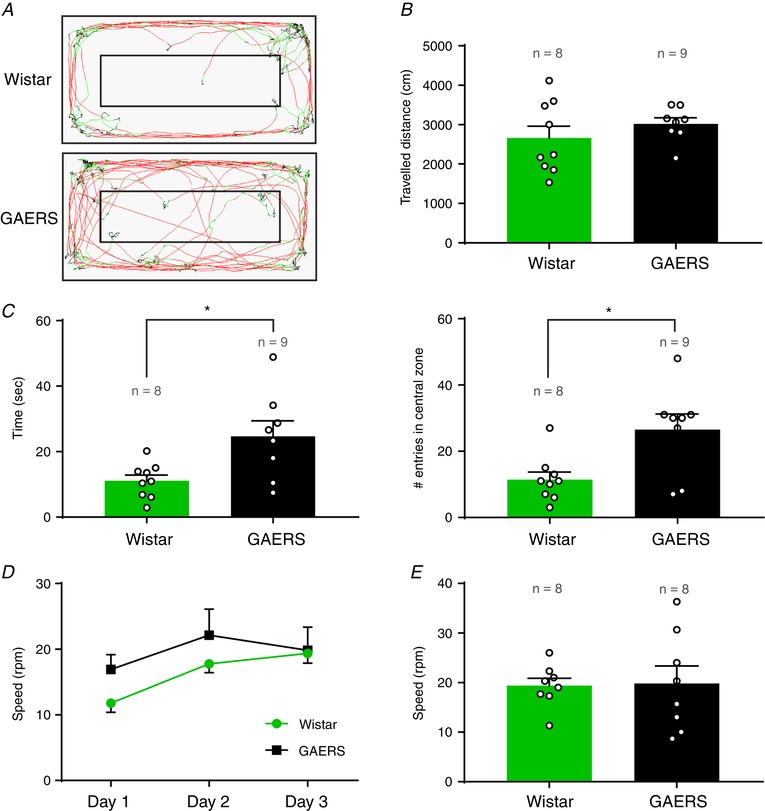
Figure 6. Locomotor and anxiety‐like behaviour evaluation.

A, example trace of locomotion in a Wistar (top) and a GAERS (bottom) during a 10 min locomotion test (red: fast movements; green: slow movements; black: immobility). B, quantification of the total distance travelled during 10 min in the open field. C, quantification of the time spent (left) and the number of entries (right) in the central zone during 10 min in the open field. D, learning curve of trials in the rotarod test. Day 3 corresponds to the test day shown in (E). E, maximum speed reached on the rotarod test (day 3). (mean ± SEM; n = 8–9 rats per group; Wistar (green) and GAERS (black); open circles represents one rat; * P ≤ 0.05, Mann–Whitney test).
