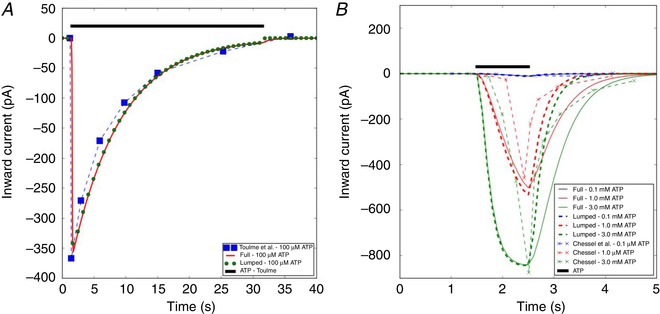
Figure 2. Inward currents via P2X4 and P2X7.

A, inward P2X4 current profile recorded in microglia (blue boxed) by Toulme & Khakh (2012) and the model prediction (red solid and green bead) when subject to 100 μM ATP for 30 s. B, inward P2X7 currents measured in microglia by Chessell et al. (1997) as well as the model predictions, when subject to 100 μM to 3 mM ATP for 0.5 s. Conditions to model the experimental conditions are listed in Table S2 (see also Sect. A.3.1 in Supporting Information). [Color figure can be viewed at wileyonlinelibrary.com]
