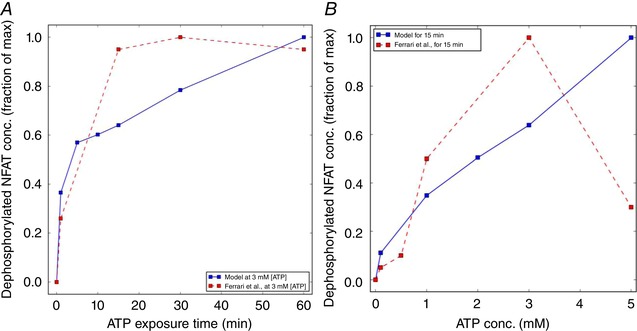
Figure 4. Predictions of dephosphorylated NFAT concentration as a function of ATP exposure time and concentrations.

A, activated (dephosphorylated) NFAT following 3 mM ATP treatment for up to 60 min recorded by Ferrari et al. (1999) (dashed) and predicted by the model (solid). B, analogous predictions of activated NFAT, subject to 15‐min treatments of ATP up to 5 mM vs. experiment (Ferrari et al. 1999) Parameters and conditions to model the experimental conditions are listed in Table S2. [Color figure can be viewed at wileyonlinelibrary.com]
