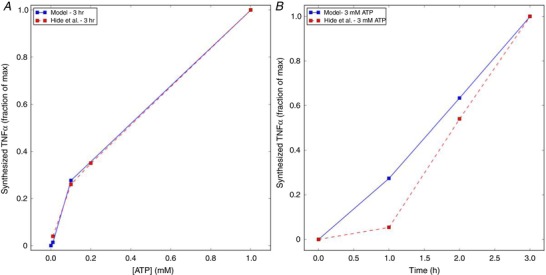
Figure 6. Predictions of TNFα production as a function of ATP concentration and exposure time.

A, predictions (solid) of TNFα production following 3 h of micromolar to 1 mM ATP exposure vs. exocytosed protein collected by Hide et al. (2000) (dashed), assuming that exocytosed TNFα scales proportionally to the total amount of TNFα synthesized. B, TNFα production predictions (solid) as a function of time (h), following 3 mM ATP treatment vs. experiment (dashed). Parameters and conditions to model the experimental conditions are listed in Table S2. [Color figure can be viewed at wileyonlinelibrary.com]
