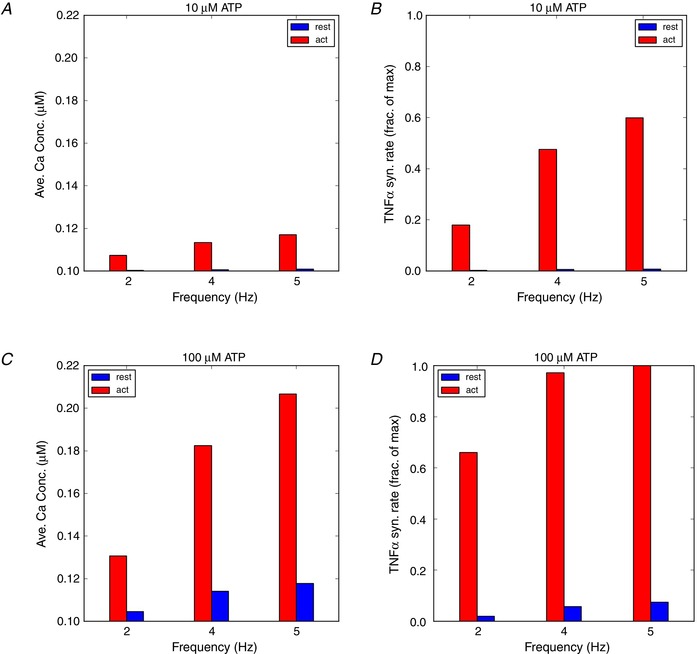
Figure 8. Predicted increase in intracellular Ca2+ concentrations (averaged from 10 to 20 s) and TNFα synthesis rates in activated microglia (red) and the cell at rest state (blue).

The P2X4 channel density parameters (ρP 2 X) for cells at rest (1×) and LPS‐activated (30×) are listed in Tables S3 and S4. [Color figure can be viewed at wileyonlinelibrary.com]
