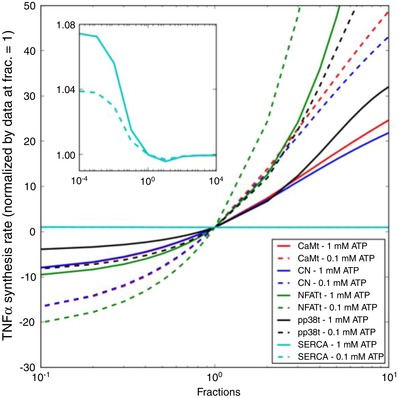
Figure 10. Sensitivity of predicted synthesis rate of TNFα to variations in model parameters.

Degree of TNFα synthesized as a function of total CaM (red), CN (blue), NFAT (green), SERCA pump capacity (cyan) or p‐p38 (black) concentration with respect to 1 Hz, 0.1 and 1.0 mM ATP pulses for 300 s. [Color figure can be viewed at wileyonlinelibrary.com]
