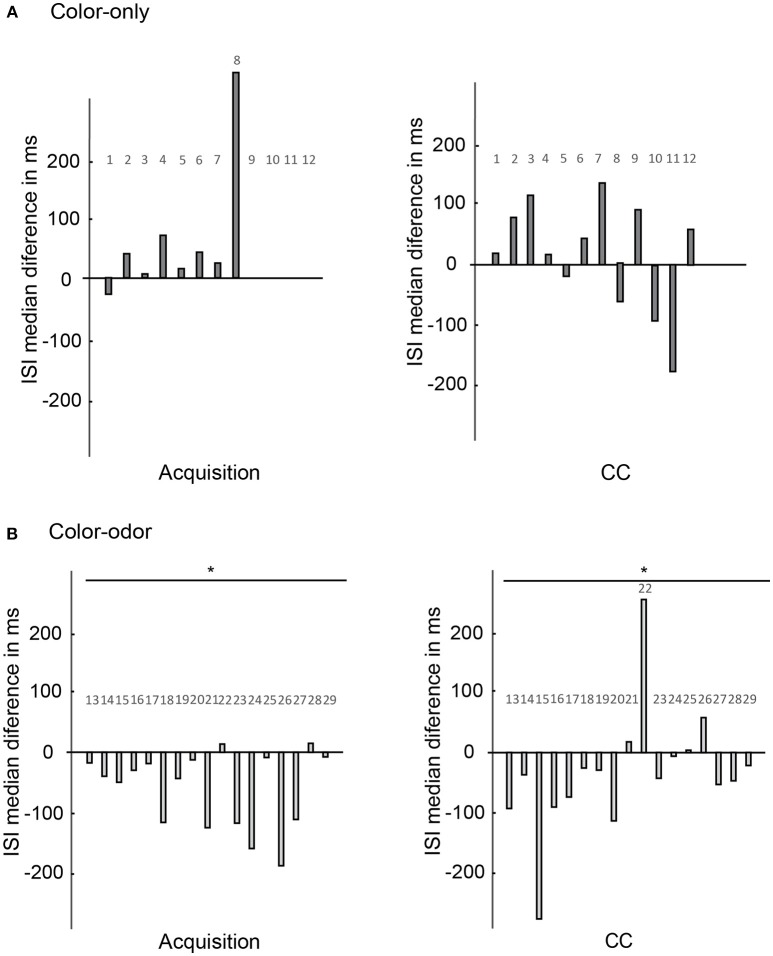
Figure 10.
Changes of the ISI medians as compared for the acquisition and the CC phase. Changes of ISI medians of the units (x-axis) are calculated for the 600 ms after stimulus onset in the pre-test and in the post-test (y-axis). (A) Color-only paradigm: ISI medians of 12 units (x-axis) during the acquisition phase and the CC phase. The changes of ISI medians are not significantly different for color onset as compared to reward onset (N = 12, Wilcoxon signed-rank test, p > 0.05). No significant changes are found for the CC phase comparing the pre-test and post-test (N = 12, Wilcoxon signed-rank test, p > 0.05). (B) Color-odor paradigm: Changes in ISI medians are significantly different during the acquisition for the color and the reward onset (N = 17, Wilcoxon signed-rank test, p = 0.005). The changes of ISI medians are also significantly different for the CC for the pre-test and post-test comparison (N = 17, Wilcoxon signed-rank test, p = 0.046). Asterisks indiacte statistical significance.

