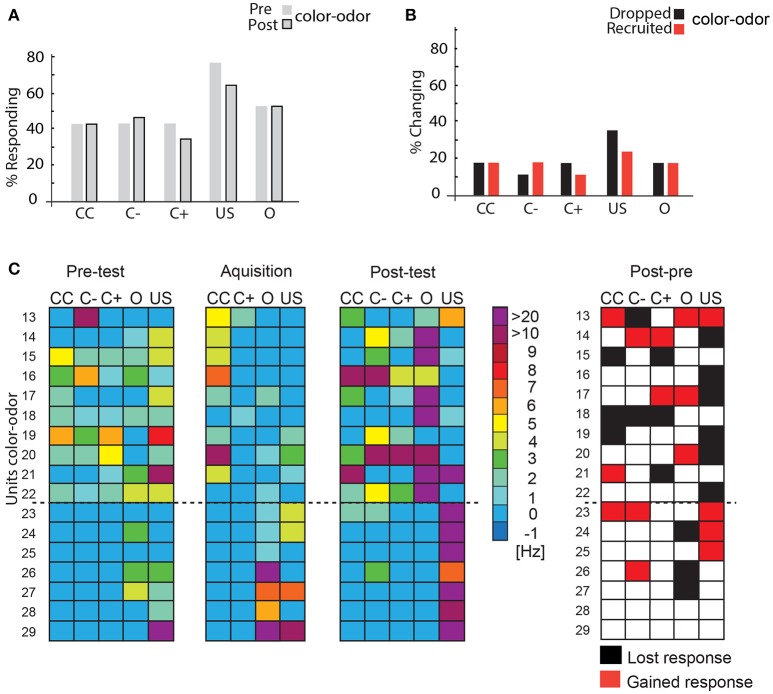
Figure 8.
Learning-related plasticity during the color-odor paradigm. (A) No significant changes occurred in the percentage of responding units from the pre- test to the post-test (McNemar test, p >0.5). (B) Percentage of changing responses categorized as being recruited and dropping out as measured for the different stimulus conditions. (C) Left side: Single unit response in the pre-test, during the acquisition and in the post-test for the different stimulus conditions. Excitatory responses are marked in warm colors. The warmer the color, the higher the change in the respective activity. No change in activity compared to before is marked in blue. No inhibitory responses were found during the analysis most likely due to the rather low spike activity and the high criterion for the significant test (mean minus three standard deviation) N = 17. Right side: Summary of recruited or dropped units after learning. Here, dropped and recruited refers to post-test compared to the pre-test for all stimuli. Black indicates that the unit responded less to the respective stimulus in the post-test than in the pre-test, red indicates that the unit responded more than in the pre-test, white indicates no change; US, unconditioned stimulus (reward). Only two units did not change their responses (number 28 and 29). CC, response during the color choice with both colors blue and yellow present; C+, response to the rewarded color; C–, response to the unrewarded color; US, response to the sucrose reward.

