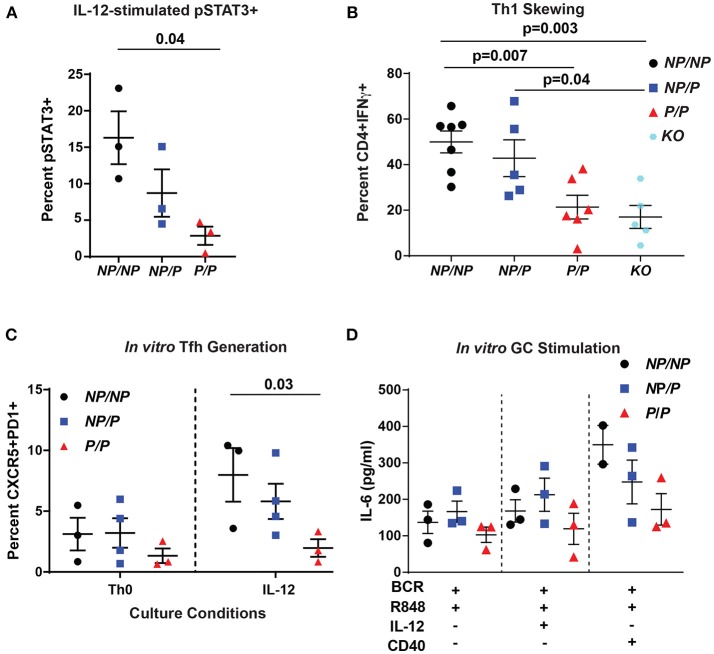
Figure 2.
Murine Tyk2P lymphocytes exhibit decreased IL-12 signaling and reduced in vitro generation Tfh cells and IL-6 production in response to GC programming. (A–C) Splenic CD4+ T cells were isolated from Tyk2NP/NP (NP/NP), Tyk2NP/P (NP/P), Tyk2P/P (P/P), or Tyk2−/− (KO) mice. (A) CD4+ T cells were stimulated with 2 ng/mL of IL-12 for 20 min and assessed for phosphorylation of STAT3 (pSTAT3) using flow cytometry. (B) Frequency of IFN-γ+ CD4+ T cells following in vitro Th1 skewing culture conditions with IL-12, IL-2, and anti-IL-4 for five days and analyzed by flow cytometry. (C) Frequency of Tfh-like T cells (CD4+ CXCR5+PD1+) following culture with the indicated cytokines for six days. (D) Splenic B cells were isolated from Tyk2NP/NP (NP/NP), Tyk2NP/P (NP/P), or Tyk2P/P (P/P) mice. IL-6 production from B cells stimulated with the indicated cytokines for 48 h. Small horizontal lines indicate the mean (± s.e.m.). Statistical analysis were performed using Friedman Test with Dunn's multiple comparison (A), one-way ANOVA with Tukey's multiple comparisons test (B,D), and two-way ANOVA with Tukey's multiple comparisons test (C). Data are derived from three (A,C,D) or seven independent experiments (B). Each symbol represents an individual biological replicate (individual mouse); Tyk2NP/NP n = 3, Tyk2NP/P n = 3, or Tyk2P/P n = 3 (A,D); Tyk2NP/NP n = 7, Tyk2NP/P n = 5,Tyk2P/P n = 6 or Tyk2KO n = 5 (B); Tyk2NP/NP n = 3, Tyk2NP/P n = 4, or Tyk2P/P n = 3 (C).

