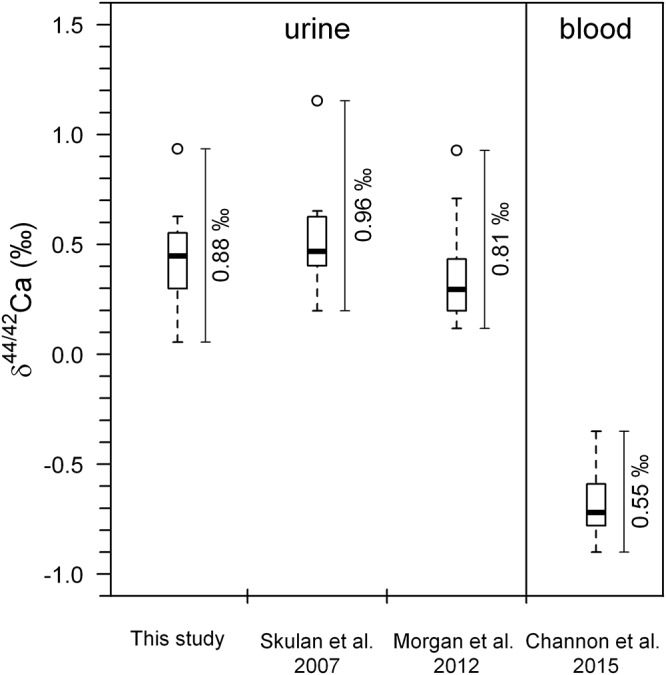
Figure 2.

Boxplots of Ca isotopes showing pre-bed rest data (BDC) for all subjects combined from this study (n = 7), along with the studies of Skulan et al. (2007) (n = 9), Morgan et al. (2012) (n = 12), and Channon et al. (2015) (n = 12). Data from Channon et al. (2015) and Morgan et al. (2012) were obtained from identical subjects in the same bed rest study. Open circles represent statistical outliers. The span (max–min) in the δ44/42Caurine values is higher than the observed span in δ44/42Cablood values. The data from Skulan et al. (2007) have been recalculated from the original δ44/40Ca values. All literature data have been converted to conform to NIST SRM-915a reference material (see Section 3.2).
