
Figure 4.
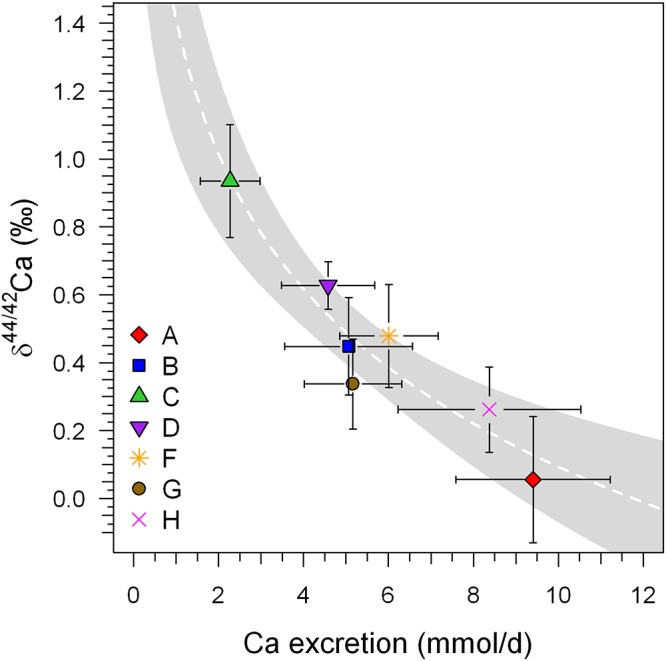
Mean δ44/42Caurine (±1SD) of the BDC (BDC-6 and BDC-2) phase of each subject plotted against the average excreted Ca per 24 h (±1SD). A significant logarithmic correlation exists that is statistically significant (r2 = 0.884, P < 0.001; white dashed line). Such a correlation is typical for Rayleigh-type fractionation such as might be expected during generation of secondary urine in the kidneys. These data were collected before and after the head-down-tilt bed rest period. The gray shaded area represents the 95% confidence band of the logarithmic regression trend.